Download
1 / 13
140 likes | 323 Views
Architects. Product Manufacturers. Federal, Local, and State Governments. Building Owners. Nonprofit Leaders. Planners. USGBC. Engineers. Interior Designers. Financial Planners. Utility Managers. Landscape Architects. Building Tenants. Property Managers. Code Officials.

E N D
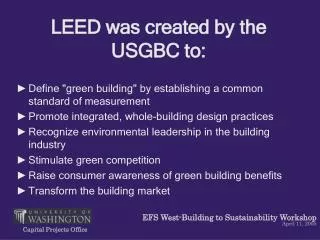
Architects Product Manufacturers Federal,Local,and State Governments BuildingOwners Nonprofit Leaders Planners USGBC Engineers Interior Designers Financial Planners Utility Managers Landscape Architects BuildingTenants PropertyManagers CodeOfficials Test
Who are we? USGBC is a community of leaders working to transform the way buildings and communities are designed, built, and operated. We envision an environmentally responsible, healthy, and prosperous environment. Test
STEWARD this market transformation OFFER expertise USGBC EDUCATE the industry and the public PROVIDE tools FORUM for industry dialog Test
7600 USGBC membership growth reflects the expansion of green buildings in the market 5832 4970 huge growth in the last 5 years T O T A L M E M B E R S 3532 2370 1137 steady growth in the first 5 years 570 268 Test 158 102 61 2005 2006 1996 1997 1998 1999 2000 2001 2002 2003 2004
USGBC Chapters, Organizing Groups, & Affiliates As of 04/06 68 Alaska Hawaii USGBC Chapters Organizing Groups Affiliates Test Caribbean
U.S. Building Impacts: 30% Greenhouse Gas Emissions 65% Waste Output 12% Water Use 70% Electricity Consumption Test
Average Savings of Green Buildings WASTE COST SAVINGS 50-90% WATER USE SAVINGS 30-50% CARBON SAVINGS 35% ENERGY SAVINGS 30% Source: Capital E Test
What is the LEED System? Scores are tallied for different aspects of efficiency and design in appropriate categories. For instance, LEED assesses in detail: 1. Site Planning 2. Water Management 3. Energy Management 4. Material Use 5. Indoor Environmental Air Quality 6. Innovation & Design Process LEADERSHIP in ENERGY and ENVIRONMENTAL DESIGN A leading-edge system for certifying DESIGN, CONSTRUCTION, & OPERATIONS of the greenest buildings in the world Test
Levels of LEED Ratings Green Buildings worldwide are certified with a voluntary, consensus-based rating system. USGBC has four levels of LEED. Test
2006: 642 million square feet. Increase in LEED Projects in three years. 2005: 500 million square feet. 2004: More than 180 million square feet. 2003: More than 141 million square feet. 2002: More than 80 million square feet. Test
$200 BILLION PROJECTED Estimated value of new LEED for New Construction registered projects The value of U.S. construction starts significantly declined by almost half from 2000 to 2003 $10 BILLION $7.73 BILLION $5.76 BILLION $3.81 BILLION $3.24 BILLION $792 MILLION Test 2006 2000 2001 2002 2003 2004
200+ LEED for new construction buildings Distributionby geography 186 480 23(DE) 24(NH) 134 174 33 9 4 22 173 105 119 36 11 9 11 68 120 12 AK=10 HI=16 PR=1 23 79 40 27 61 28 69 14 95 9 (DE) 38 (DC) 19 4 57 8 74 5 (OK) 11 82 25 22 52 102 125 19 18 6 6 73 100-199 as of 07/06 50-99 20-49 1-19 Test