Download
1 / 12
120 likes | 269 Views
Focus Area 16: Maternal, Infant, and Child Health Progress Review. October 22, 2003. Healthy People 2010 Focus Area 16 Objectives. Healthy Pregnancies and Healthy Infants. Fetal and infant deaths Low and very low birth weight Preterm births Spina bifida and other neural tube defects.

E N D
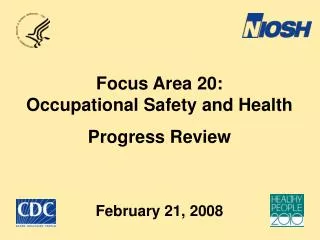
Focus Area 16:Maternal, Infant, and Child HealthProgress Review October 22, 2003
Healthy People 2010 Focus Area 16 Objectives Healthy Pregnancies and Healthy Infants Fetal and infant deaths Low and very low birth weight Preterm births Spina bifida and other neural tube defects
Infant Death Rates (Within 1 Year) by Race and Ethnicity: 1998 - 2001 Per 1,000 live births Black, Not Hispanic Native Hawaiian/ Other Pacific Islander American Indian/ Alaska Native Total 2010 Target White, Not Hispanic Hispanic* Asian Obj. 16-1c * Persons of Hispanic origin may be of any race. Source: NVSS, NCHS, CDC.
Infant Death Rates (Within 1 Year) by Race and Ethnicity: 1998 - 2001 Per 1,000 live births International rates (2000) --- Bosnia – 15 Black, Not Hispanic Native Hawaiian/ Other Pacific Islander American Indian/ Alaska Native ---Kuwait – 9 Total ---Canada – 6 --- Japan – 4 2010 Target White, Not Hispanic Hispanic* Asian Obj. 16-1c * Persons of Hispanic origin may be of any race. Source: NVSS, NCHS, CDC.
All Infant Deaths (Within 1 Year) by State: 1998-2000 2010 Target = 4.5 D.C. N Per 1,000 live births (6) (9) (15) (13) (8) 9.0 or more 8.0 - 8.9 7.0 – 7.9 6.0 – 6.9 Less than 6.0 Obj. 16-1c Source: NVSS, NCHS, CDC.
All Infant Deaths (Within 1 Year) by State: 1998-2000 2010 Target = 4.5 D.C. N Per 1,000 live births (6) (9) (15) (13) (8) 9.0 or more 8.0 - 8.9 7.0 – 7.9 6.0 – 6.9 Less than 6.0 Obj. 16-1c Source: NVSS, NCHS, CDC.
Hispanic* VLBW VLBW VLBW VLBW VLBW Total LBW Total LBW Total LBW Total LBW Total LBW 146.3 1271.5 2635.3 162.0 721.7 1291.4 134.1 1071.8 2723.9 76.4 1130.5 6261.0 27.1 78.4 102.5 113.5 230.3 262.3 45.6 122.5 124.5 21.0 303.2 1655.5 85.3 630.1 2608.5 29.3 443.3 2438.8 Leading Causes of Infant Death (Within 1 Year): 2001 Infant deaths per 100,000 live births Black, Not Hispanic White, Not Hispanic Cause of death All races VLBW Total LBW Birth defects 137.6 1011.8 2247.8 Preterm & LBW 109.5 1361.8 7105.0 293.5 2159.3 8961.4 77.5 1081.6 6157.1 SIDS 55.5 139.4 159.4 Maternal complications 37.3 459.1 2353.6 * Persons of Hispanic origin may be of any race. Source: NVSS, NCHS, CDC.
Hispanic* Hispanic* Hispanic* Hispanic* VLBW VLBW VLBW VLBW VLBW VLBW VLBW VLBW VLBW VLBW VLBW VLBW VLBW VLBW Total LBW Total Total Total Total LBW LBW LBW LBW Total Total Total Total LBW LBW LBW LBW Total Total Total Total LBW LBW LBW LBW Total LBW 146.3 146.3 146.3 146.3 1271.5 1271.5 1271.5 1271.5 2635.3 2635.3 2635.3 2635.3 162.0 162.0 162.0 162.0 721.7 721.7 721.7 721.7 1291.4 1291.4 1291.4 1291.4 134.1 134.1 134.1 134.1 1071.8 1071.8 1071.8 1071.8 2723.9 2723.9 2723.9 2723.9 76.4 76.4 76.4 76.4 1130.5 1130.5 1130.5 1130.5 6261.0 6261.0 6261.0 6261.0 27.1 27.1 27.1 27.1 78.4 78.4 78.4 78.4 102.5 102.5 102.5 102.5 113.5 113.5 113.5 113.5 230.3 230.3 230.3 230.3 262.3 262.3 262.3 262.3 45.6 45.6 45.6 45.6 122.5 122.5 122.5 122.5 124.5 124.5 124.5 124.5 21.0 21.0 21.0 21.0 303.2 303.2 303.2 303.2 1655.5 1655.5 1655.5 1655.5 85.3 85.3 85.3 85.3 630.1 630.1 630.1 630.1 2608.5 2608.5 2608.5 2608.5 29.3 29.3 29.3 29.3 443.3 443.3 443.3 443.3 2438.8 2438.8 2438.8 2438.8 Leading Causes of Infant Death (Within 1 Year): 2001 Infant deaths per 100,000 live births Infant deaths per 100,000 live births Infant deaths per 100,000 live births Black, Not Hispanic Black, Not Hispanic Black, Not Hispanic White, Not Hispanic White, Not Hispanic Cause of death Cause of death Cause of death Cause of death All races All races All races All races VLBW VLBW VLBW Total Total LBW LBW Total LBW Birth defects Birth defects 137.6 137.6 1011.8 1011.8 2247.8 2247.8 Preterm & LBW Preterm & LBW 109.5 109.5 1361.8 1361.8 7105.0 7105.0 293.5 2159.3 8961.4 77.5 1081.6 6157.1 SIDS SIDS 55.5 55.5 139.4 139.4 159.4 159.4 Maternal Maternal complications 37.3 37.3 459.1 459.1 2353.6 2353.6 * Persons of Hispanic origin may be of any race. Source: NVSS, NCHS, CDC.
Very low birth weight Low birth weight LBW (<5 lbs 8 oz) and VLBW (<3 lbs 4 oz) by Race and Ethnicity: 2001 Percent of live births LBW 2010 Target VLBW 2010 Target Asian Hispanic* White, Not Hispanic Total American Indian/ Alaska Native Native Hawaiian/ Other Pacific Islander Black, Not Hispanic Obj. 16-10 * Persons of Hispanic origin may be of any race. Source: NVSS, NCHS, CDC.
Sudden Infant Death Syndrome and Sleep Position: 1996 - 2001 SIDS deaths Per 100,000 live births SIDS deaths 2010 Target 1996 1997 1998 1999 2000 2001 Obj. 16-1h Sources: NVSS, NCHS, CDC; NISPS, NICHD, NIH.
Sudden Infant Death Syndrome and Sleep Position: 1996 - 2001 SIDS deaths Infants put to sleep on their backs Per 100,000 live births Percent Sleep position 2010 Target SIDS deaths 2010 Target 1996 1997 1998 1999 2000 2001 Obj. 16-1h & 16.13 Sources: NVSS, NCHS, CDC; NISPS, NICHD, NIH.
Progress review data and slides can be found on the web at: http://www.cdc.gov/nchs/hphome.htm