Download
1 / 37
370 likes | 370 Views
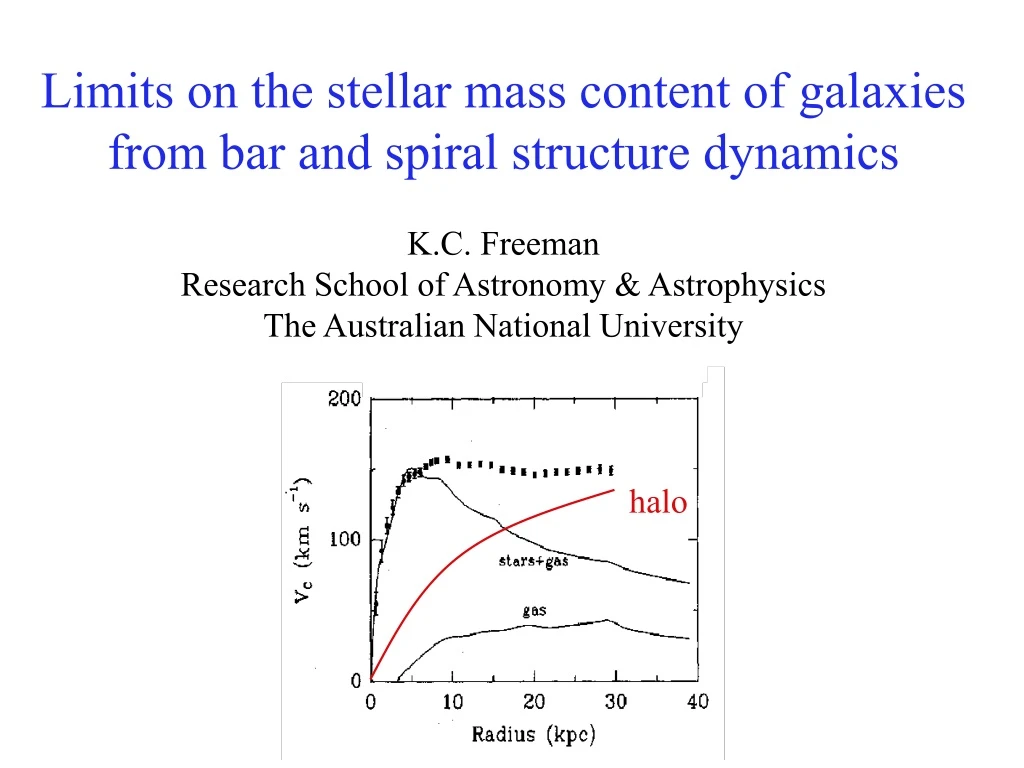
halo. Limits on the stellar mass content of galaxies from bar and spiral structure dynamics K.C. Freeman Research School of Astronomy & Astrophysics The Australian National University. For many spirals, the HI rotation curves extend to large radii, in some examples to more than 20 disk

E N D
halo Limits on the stellar mass content of galaxies from bar and spiral structure dynamics K.C. Freeman Research School of Astronomy & Astrophysics The Australian National University
For many spirals, the HI rotation curves extend to large radii, in some examples to more than 20 disk scalelengths. The expected V(R) from stars and gas falls well below the observed rotation curve in the outer region of these galaxies, and dark matter becomes the dominant contributor to the radial potential gradient ∂∂R
NGC 3198 halo Begeman 1987
halo For this decomposition of NGC 3198, the stellar M/L ratio was taken to be as large as possible without leading to a hollow dark halo - this is a maximum disk (minimum halo) decomposition. Is this correct for high surface brightness galaxies like NGC 3198 ? (We know that LSB disks are usually sub-maximal and their rotation curves are dominated everywhere by the dark halo).
halo The maximum disk question is important because inferences about the properties of dark halos from rotation curves depend so much on the correctness of the maximum disk interpretation. eg if the maximum disk decompositions are correct, then the dark halos have approximately uniform density cores which are much larger than the scale length of the disk
In contrast, the halos that form in cosmological simulations have steeply cusped inner halos with r -1 or even steeper near the center This has led to a long and unresolved controversy between observers and simulators.
Maximum disk Minimum halo Lighter disk Heavier halo The disk-halo degeneracy for NGC 3198: decompositions are almost as good for two different combinations of halo and disk parameters. How to break this degeneracy ? van Albada et al 1985
Sometimes one decomposition looks better than another. e.g. NGC 5055 (Battaglia et al 2006) - very extended HI with spiral structure in outer HI disk optical HI (T. Oosterloo's web page)
NGC 5055: maximum disk decomposition is a better fit than the minimum disk, but this may depend on the adopted model for the dark halo (usually pseudo isothermal sphere) Battaglia et al 2006
Need independent ways to break the disk-halo degeneracy One way is to use M/L values for the disk derived from stellar population synthesis models : eg Bell & de Jong 2001. These models give a relation between the M/L ratio and the color of a stellar population. Need to adopt a star formation history (eg single burst or constant star formation rate) and a stellar IMF. I think this is useful, but there are uncertainties: others prefer dynamical methods Kassin et al (2006) made a study of 34 galaxies using an M/L - (B-R) relation from SPS models. Calculates Vmax for the disk and compares it with the observed Vmax : most disks are near-maximal (ie provide more than 90% of the observed rotation at 2.2 disk scalelengths)
Comparison of Vmax for SPS disk and observed Vmax for 34 spirals - most disks are close to maximal (provide more than 90% of observed rotation at R = 2.2 scalelengths) Kassin et al 2006
Dynamical methods : use the flow fields of gas in non-axisymmetric galaxies to measure the contribution of the disk to the total potential (assuming that any asymmetry of the dark halo is not important on the relevant scales) Debattista & Sellwood (2000) and Sellwood & Debattista (2006) argued that dynamical friction of the halo on the bar would not permit the high observed pattern speeds of bars unless the halo density is low. Their disks must then be close to maximal. Technical arguments against this conclusion were raised by Athanassoula (2003) and Valenzuela & Klypin (2003)
Gas flows in barred galaxies Weiner et al 2001: the barred galaxy NGC 4123.
Use I-band surface photometry to derive the shape of the potential for the stellar disk. Make flow models adjusting • the disk M/L (assumed constant) • the pattern speed of the asymmetric part of the stellar mass distribution, and • the dark halo parameters to match the rotation curve, the morphology of the spiral structure and the amplitude of the gas flow asymmetries
NGC 4123 M/L ratio for the stellar disk, and pattern speed for the asymmetric part of the mass are both well constrained by the gas flow field. Weiner et al 2001
NGC 4123 Shows the sensitivity of the flow field to the M/L ratio of the stellar disk. Weiner et al 2001
Conclusion for NGC 4123(Vmax = 145 km/s) In order to match the flow field, the M/L ratio of the disk needs to be 80-100% of the maximum disk value, and the bar is rotating rapidly
Related study by Perez et al (2004) used M/L values for the stellar disk from I and H-band photometry and SPS, again using the observed non-circular motions to break the halo-disk degeneracy: similar conclusion for two galaxies (Vmax < 170 km/s) about near-maximal disks and fast rotating bars.
Spiral Structure Limits Athanassoula et al (1987) used spiral swing amplifier theory as an additional constraint on the M/L ratio of the disk. • choose the largest M/L value for the disk allowed by the rotation curve, without having a hollow halo (maximum disk) • decrease M/L to level where m=1 amplification is inhibited over the observed range in radius (maximum disk, no m=1) • decrease M/L to level where m=2 amplification is inhibited over the observed range in radius (minimum disk, no m=2) Outcome : most disks are close to maximum For example ...
no m=1 disk no m=2 disk halo halo M33 Decompositions with maximum no m=1 disk and minimum no m=2 disk Athanassoula et al 1987
symbol: no m=1 disk error bars: upper is maximum disk lower is "no m-=2 disk" most disks are close to maximum curves are various stellar population models available at the time Athanassoula et al 1987
Kranz et al 2001, 2003 : use numerical dynamics of spiral structure to break the disk-halo degeneracy (cf Weiner et al) • K-band images of spirals and M/LK - (V-K) relation are used to estimate the potential of the stellar disk (including spiral arms) • Make hydro simulations of gas flow in this potential, varying • the pattern speed of the asymmetric part of the potential to best match the morphology. • the fractional maximality fd of the disk (fd = 1 for maximal disk) to best match the wiggles in the gas kinematic.
NGC 4254 simulations: match morphology overall Note how the young star formation regions are very visible in the K-band image - these may make the asymmetry appear stronger than it really is. Kranz et al 2001
• from Athanassoula et al 1987 (Vmax > 100 km/s) Galaxies with maximum rotational velocity > 200 km/s are close to maximal ie fd > 85%. Less massive spirals are progressively less maximal although many of the unplotted smaller Athanassoula galaxies are close to maximal. Kranz et al 2003
Another example: Rautianen et al (2004) applied a similar method to the unusual 4-armed spiral ESO566-24 (Vmax = 200 km/s) Their best match to the morphology and kinematics has a halo contributing < 20% of the total mass within 2.2 scale lengths (ie close to maximal disk) Consistent with Kranz et al 2003 compilation
Summary of conclusions from bars and spiral structure The disk mass fraction appears to be high (> 80%) for galaxies with Vmax > 200 km/s but smaller for smaller spirals. However, many small galaxies (Vmax < 100 km/s) of Athanassoula et al (1987) not plotted here are close to maximal, as are the smaller bar flow field galaxies.
Flaring of HI disks The flaring of HI disks provides another way to break the disk-halo degeneracy. HI flaring in the outer disk has been used so far mainly to estimate the flattening of dark halos (eg Olling & Merrifield 2000 for the Milky Way). In the inner disk, HI flaring is not very sensitive to the shape of the dark halo, but provides another potential estimator of the disk's M/L ratio.
Flaring of HI layer in the Galaxy: The HI layer has a roughly isothermal velocity dispersion (~ 8 km s -1 ). In a spherical dark halo, the outer HI layer will flare vertically more than in a flattened dark halo. For the Galaxy, Olling & Merrifield (2000) find that the axial ratio q 0.8 from the flaring of the HI layer. HI flaring is a powerful technique - it provides a measure of ∂/∂z to combine with ∂/∂R from rotation data. Can be used to sort out the maximum disk controversy because ∂/∂z near the plane comes mainly from the stellar disk in the inner Galaxy. HI flaring will be used more in future as good high resolution HI data becomes available for edge-on galaxies.
Flaring of the Galactic HI layer gives constraint on flattening of the dark halo Olling & Merrifield 2000
The hydrostatics of the HI layer is used to derive the total gravitational potential gradient. Need to know • the density distribution of the HI layer as a function of radius (eg surface density and flaring) • how the HI velocity dispersion (R,z) changes with R and z. eg if (R,z) decreases with z, then the observed HI flaring implies a more spherical dark halo than if (R,z) is isothermal (as usually assumed). It is now possible to make these measurements, including (R,z), for relatively nearby edge-on galaxies (O'Brien et al 2007)
Example of measuring flaring and HI velocity dispersion in other galaxies: UGC 7321 observed at VLA by Matthews et al (1999). HI analysis by O'Brien et al (2007) R-band image
For UGC 7321, onion-skin analysis, working inwards from large radii, gives simultaneously • the rotational velocity and HI surface density • the flaring of the HI layer and • the HI velocity dispersion (R), averaged over z. The S/N of the existing VLA data for UGC 7321 was not sufficient to derive the z-dependence of (R,z), but higher S/N data will allow full derivation of (R,z).
HI properties of UGC 7321 Rotation Velocity dispersion Surface density FWHM O'Brien et al 2007
To illustrate the power of HI flaring ... Kalberla et al (2007) use the HI flaring of the Galactic HI layer to explore the Galactic potential. The flaring data is extends to R = 40 kpc and z = 20 kpc, but little is known about how the HI velocity dispersion changes with height above the galactic plane. They had to assume an isothermal velocity dispersion for the Galactic HI. Their conclusions depend on this assumption, which may not be correct.
To fit the observed HI flaring, they need • the usual dark halo with a mass of about 1.8 x 10¹² M out to T = 350 kpc, plus • a dark disk with a scale length hR = 8 kpc, a scale height hz = 4 kpc and a mass of about 2 x 10¹¹ M.. (The mass of the dark disk is about 4 times larger than the mass of the stellar disk - this dark disk would have escaped detection via stellar kinematics). • also need a dark ring at R = 13-20 kpc, with mass of 2.5 x 10¹⁰ M, maybe associated with the Monoceros stellar ring.