Download
1 / 8
80 likes | 84 Views
Learn how to use COPLINK to enhance beat meetings, community policing events, and public speaking. Show your officers how to identify and address crime patterns using COPLINK's powerful analytical capabilities.

E N D
Liaison Tip Set the example Did you know that COPLINK is not just an investigative tool? Your Field Officers are responsible for beat meetings, Community Policing events and public speaking. It’s part of the responsibility of the Contemporary Officer. They look to you for the how to make it look right and how to make it meaningful. I’ll show you, you show them!
Your Officer wants to show the residents in the area between 1st and Cherry from Fort Lowell to Glenn that they have a burglary problem. The Officer can’t find help from analyst because the analysts are preparing for a Comp Stat Meeting. You show the Officer how to do it with COPLINK
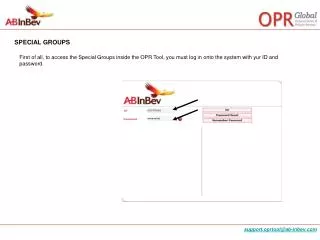
Start by showing the area and the burglaries. This is demo data, so we won’t set a range because there isn’t that much data. You will want to set the range. Open the top refined search pane first Go to location search, click binoculars, open the find address and search for Glenn and 1st In the document search, enter your agency, departmental report or case (however your agency is mapped), your date range then add to the top refined search pane
A gold star appears to guide you. Dig down and when you get to the area, take the square and make a square in the area from Fort Lowell to Glenn, from 1st to Cherry When the star appears use the digging tool to go lower so you can see the neighborhood, Highlight the affected area, then add to the lower refined search pane and find associations
This is the result The analysis shows that there are a cluster of burglaries in the affected area Click Map
Dress it up to your preference and show the hot spots, then screen shot and put into a presentation like this one
If you are dealing with years, you can show the disparity between years in color. Simply click on the first, control click on the second and so on and control double click on the last one….
And that’s your tip for this week Mike Widmer Law Enforcement Liaison