Download
1 / 39
390 likes | 535 Views
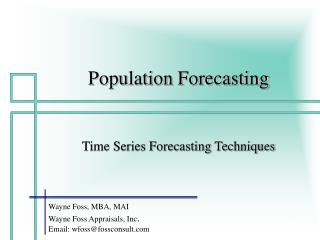
GOPB Long Term Projections: An Overview of the UPED Process. Prepared for: Wasatch Front Regional Council Socioeconomic Projections Working Group February 23, 2000. Contact Information. Pam Perlich (801) 538-1537 pperlich@gov.state.ut.us

E N D
GOPB Long Term Projections:An Overview of the UPED Process Prepared for: Wasatch Front Regional Council Socioeconomic Projections Working Group February 23, 2000
Contact Information • Pam Perlich (801) 538-1537 pperlich@gov.state.ut.us • Ross Reeve (801) 538-1545 rreeeve@gov.state.ut.us • Web Site: www.qget.state.ut.us/projections
Today’s Presentation • Relations between major planning models • UPED is regional • WFRC • sub-regional • feedback / constraints / allocation to UCAPE • Overview the UPED model • Assumptions driving the regional results
Regional Economic / Demographic Projection Model GOPB Planning Models Geographic Information System AGRC Small Area Allocation Models MPOs, AOGs Water Supply/Demand Model DWR Transportation Planning Models MPOs, UDOT Air Quality Models DAQ
Utah Process Economic & Demographic Model (UPED) Economic Base Model Cohort Component Model Integrated Regional Economic and Demographic Projections
Economic Base Model Regional Growth of the Export Sector Regional Growth of: Residentiary Sector Resident Population
Cohort Component Model Beginning Population Plus Births Minus Deaths Plus In-Migrants Minus Out-Migrants Ending Population
UPED Model General Flowchart Population in Year t-1 Age & Survive; Births & Non- Employment Related In-Migration Adjusted Natural Increase Population Population in Year t Population Dependent Job Opportunities in Year t Non-Employment Related Out-Migration & Employment Related Net In-Migration in Year t Labor Force in Year t Total Job Opportunities in Year t Labor Market Direct Basic Job Opportunities in Year t Model Components Iterative Inputs & Outputs Recursive
UPED Employment Total Employment (TEDi) Residentiary Employment (REDi) Basic Employment (BEDi) Permanent Basic Employment (BEDPi) Temporary Basic Employment (BEDTi) Change in Permanent Basic For Event or Impact (BEDPACi or BEDCACi) Growth Rate of Permanent Basic For Baseline (BEDPGi or BEDPGRi) Production for Regional Consumption Direct & Indirect = If Baseline Production for Export Direct & Indirect
Economic Growth Projections • Employment growth is the driver of the long run population path in the UPED model. • These employment projections combine “top down” and “bottom up” methods.
Long Term Employment Growth • Net in-migration contributed 17% of population increase from 1948 - 1998. • Long term employment growth is sufficient to generate the same relative component contributions for 1999 - 2050.
Short Term Employment Growth • State level major industry employment for 1999 through 2004 is controlled to the results of the state’s short term models. • The results of the GOPB Olympic impact study are included.
Employment Projections • Firm and industry specific assumptions have been produced by analysts at • Workforce Information, DWS • Associations of Government • Metropolitan Planning Organizations • Department of Natural Resources • Governor’s Office of Planning and Budget
Industry Assumptions • Coal mining, oil and gas extraction, and petroleum and coal manufacturing are produced by analysts in Department of Natural Resources. • Construction has been modeled separately and converges to its historical mean share of employment in each region. • Some industries are not treated as special cases. The employment in these is generated by the model by maintaining relative differences with the national projection series.
Total State Employment and Population 3,683,687 2,290,819
Fertility Assumption • Hold fertility constant at 1998 rates • 1998 rate for Utah was 2.6 • 1998 rate for the U.S. was 2.0
Historical and Projected Total Fertility Rates for Utah and the U.S.
Survival Assumption • Maintain mean difference in life expectancy observed in 1970, 1980, and 1990 over projection interval. • The projected US series is Census middle series.
Labor Force Participation Rate Assumption • Maintain relative differences with US projected series.
Utah Labor Force Participation Rates by Age Group: 1990 & 2020 Medium LFPR
Labor Force Participation Rates by Age Group: 1990 For Utah & US
Labor Force Participation Rates by Age Group: 2020 for Utah & US
Utah & US Births: 1930-1998 US Baby Boom: 1946-1964
Utah: 1990 Base Case: 2050 Male Female Male Female
Utah Dependency Ratios: 1970 - 2050 90 82 80 84 79 77 73 70 68
US Dependency Ratios: 1970 - 2050 79 79 80 80 65 68 62 63 60