Download
1 / 22
220 likes | 237 Views
Humber River Lab (Ecosystem Health). Paul Venturelli. Today’s Plan . Review of the lab. Talk about the lab report. Go over the questions on pg. 45. 4. Take a look at the class data. Sampling fishes. A review of the lab . - What were we doing in the Humber?.

E N D
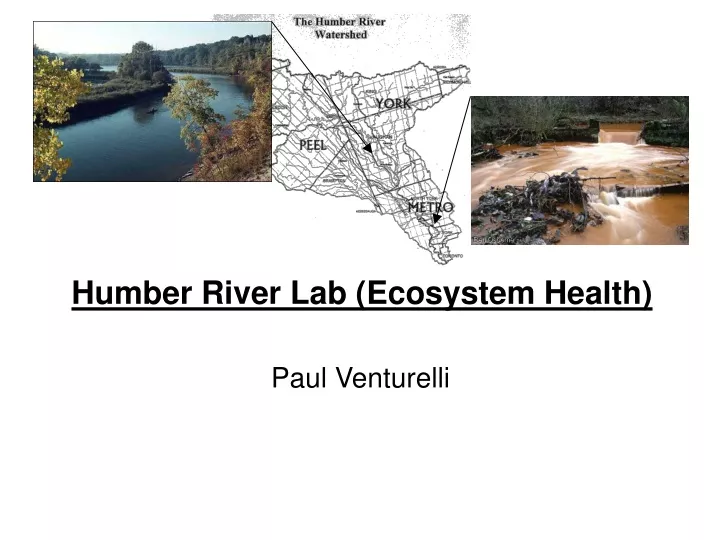
Humber River Lab (Ecosystem Health) Paul Venturelli
Today’s Plan • Review of the lab • Talk about the lab report • Go over the questions on pg. 45 4. Take a look at the class data
Sampling fishes A review of the lab - What were we doing in the Humber?
A review of the lab - Why? Fishes can be used as indicator species to determine ecosystem health
The lab report - Read your lab manual, visit www.epa.gov - Outline the story that you want to tell before you begin to write - Presentation is important
The lab report - Introduction (1 paragraph, ½ page) • Start big picture (ecosystem health), then begin to focus on the specific objective(s) of your study (fish as indicators in the Humber)…Shear et al. 2003? • Finish with your prediction(s)
The lab report - Methods (½ page, excluding figure) • Where you sampled (general to specific, including date, time, and conditions). Include a site map • How you sampled (equipment) • How the data were analyzed
The lab report - Results (¾ page, excluding tables) • Present standardized and summarized data in a table. Include row and column totals. • Write about general trends in the data that are relevant to your report. e.g., “Pools tended to support a higher abundance of fishes than other sites (Table 1).” • Describe trends, but do not interpret them
The lab report Table 1. Abundance (number/m2) of fishes at 3 sites on the Humber River. Data were collected by the class on Tuesday, Sept…
The lab report - Discussion (2 ½ to 3 ½ pages) • This is the most important part • Interpret your results, link to your objective(s) and prediction(s) • Be sure to INCORPORATE answers to the questions on pg. 45 into your discussion
The lab report - Conclusion (last 2 or 3 sentences of the discussion) • Most important findings, and how these relate to your objective(s) and prediction(s) • Bring back to the big picture in your introduction
The questions (1) • Think about your objective(s) in terms of a question • Use your results in support of an answer (what must we link to do this?) • Think about different ways of using our data to answer this question (be sure to write your results section accordingly)
The questions (2) • We assume that our results reflect the health of the Humber • What else might contribute to observed trends? • Weigh these alternative explanations against your answer to question 1
The questions (3) • Convert abundance data to presence-absence (non-zero values = 1, 0 = 0) • Does your answer to question 1 change? Are presence-absence data sufficient for assessing the health of the Humber?
The questions (4) • What are some sources of error in this study? • How have they affected your results?
The questions (5) • Can you think of other organisms that we might use as indicators? • What are the strengths and weaknesses of using these alternatives to assess health relative to fishes?
The questions (6 & 7) • 6. What have others found? Compare your results to those from other studies. • 7. What next? Where do we go from here?
Some references to get you started Eakins, R. J. 2007. Ontario Freshwater Fishes Life History Database. Version 3.01. On-line database. [www.fishdb.ca]. Updated weekly , last viewed 12 November 2007. Froese, R. and Pauly, D. Editors. 2007. FishBase. [http://www.fishbase.org]. Last updated 9 September 2007, last viewed 12 November 2007. Scott, W. B. and Crossman, E. J. 1973. Freshwater fishes of Canada. Bulletin of the Fisheries Research Board of Canada. 184. 966 pp. Shear, H., Stadler-Salt, N., Bertram, P., and Horvatin, P. 2003. The development and implementation of indicators of ecosystem health in the Great Lakes basin. Environmental Monitoring and Assessment. 88: 119-152. Toronto Regional Conservation Association. [http://www.trca.on.ca (Protecting our Water > Watershed Strategies > Humber River]. Updated weekly, last viewed 12 November 2007. U.S. Environmental Protection Agency. Biological Indicators of Watershed Health [http://www.epa.gov/bioindicators/index.html]. Last updated 26 October 2007, last viewed 12 November 2007. You can find many, many more research articles on Web of Science, which is available through U of T Libraries.
The data • How do you want to standardize and summarize the data? Look for patterns (“results”) and try to interpret them (“discussion”). • You should have a idea (or even an outline) of the story that you want to tell by the end of today’s lab
The data • Log on to my CQUEST account • Email the file to yourself • Standardize results and average • Other files: ENV234(Lecture).ppt, ENV234(MarkingKey).doc
Average groups = = = = Average times (AM & PM) = = = = Average groups Average days (2 Oct & 9 Oct) Average groups Average times (AM & PM) Average groups The data Multiplying (*): =B11*E11 Dividing (/): =G15/H15 Anchoring ($): =B15/$B14 Averaging: =average(B5:B15) Pasting values: Edit>Paste Special>Values>OK For each habitat: Average within a lab (e.g., 9 Oct AM), then between labs on the same day (e.g., 9 Oct), and then between days (2 and 9 Oct)