Download

1 / 36
360 likes | 367 Views
This confidential analysis provides an overview of SPE's current business opportunities and suggests three strategic options to optimize growth and profitability. It includes a detailed economic overview of SPE's film, television/network, and digital businesses.

E N D
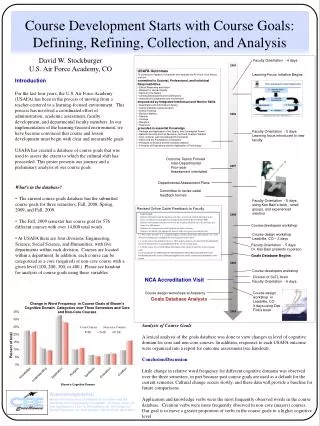
Refining SPE’s Business Detailed Analysis January 2006 CONFIDENTIAL
Overview: Opportunities to Refine SPE’s Business • SPE is seeking to drive increased growth and profitability • SPE aspires to achieve a 10% EBIT margin by FY09; however, FY06 EBIT is projected to be below 5% and FY07-09 EBIT margins are projected to be 5% to 7% • The majority of SPE’s revenues are derived from its core Columbia Pictures business, which has considerable volatility and limited margins and growth potential • To achieve this goal, SPE should evaluate 3 high-level strategic options • Optimize current assets: Maintain current portfolio of businesses, continuing to pursue incremental investments and periodically adjust capital allocation • Narrow focus: Define core competencies and divest non-core businesses • Diversify: Invest in strategic businesses where SPE has no or limited presence
Economic Overview—SPE Film Businesses Ultimate Revenue ($M) / Margin (%) Average margin FY06 gross profit2 FY06 Budget capital investment3 FY03 FY05 FY06E FY04 Line of business $2,225 19.1% $1,662 -22.0% $3,053 12.3% $2,690 6.9% 6.4% -$365 $816 Columbia1 $421 23.8% $546 23.6% $30 -8.7% $319 21.4% 22.4% $129 $88 Screen Gems $1,036 0.4% $413 -16.6% Revolution(production deal) $1,025 3.3% $975 -10.0% -3.7% -$68 $81 $155 14.7% $87 11.5% $80 10.6% $80 22.3% 14.7% $10 $27 Classics $138 16.2% $23 5.0% $37 -21.3% $19 -2.4% 7.0% $1 $25 Local language P&L Revenue ($M) / Margin (%) $564 29.5% $703 24.8% $550 26.1% $560 28.0% 27.0% $174 $150 Acquisition/DTV (SPHE)4 $4,540 16.3% $3,434 -3.5% $4,775 11.5% Total Film $4,643 7.1% 8.6% -$120 $1,187 1 Includes Oliver Twist (Tristar) 2Based on Slate Ultimates (which exclude marketing and distribution overhead); Acquisition/DTV based on P&L 3 Includes Production, Development and Acquisition Spending, Capital Expenditures and Strategic Investments 4 Based on P&L; Volume rebates, G&A expenses, and Other income removed to more accurately reflect Acquisition/DTV business
Economic Overview—SPE Television/Network Businesses Revenue ($M) / Margin (%) Average margin FY06E operating income FY06E capital investment1 FY03 FY04 FY05 FY06E Businesses $451 7.6% $635 18.8% $561 19.3% $582 12.0% 14.9%4 TV production (Broadcast Network, Cable Network, Library) $70 $306 $49 $107 23.5%4 $238 21.8% Daytime TV production $224 27.1% $221 25.7% $246 19.8% $69 $5 73.8%4 $125 66.2% 3rd party distribution2(Seinfeld, Just Shoot Me, etc.) $108 93.3% $250 70.6% $99 70.2% Made-for-syndication TV content (Wheel, Jeopardy!, Judge Hatchett) $107 $100 $334 30.8% $380 55.6% $236 38.7% $227 46.9% 43.5%4 Local language TV production $63 23.6% $67 21.4% $105 15.9% $131 14.0% 17.5%6 $18 $101 Int’l networks – Established3 $216 7.6% $175 14.7% $233 20.6% $272 16.8% 15.2% $46 $795 Int’l networks - Growth stage3 $11 8.8% $13 -15.9% $39 0.9% $64 10.3% 4.6% $7 $1,407 23.5% Total TV/Network $1,740 34.6% $1,537 26.0% $1,621 22.5% 26.9% $365 $698 1 Includes Production, Development and Acquisition Spending, Capital Expenditures and Strategic Investments2 From FY04-06E Seinfeld booked under net accounting (100% margin); all other shows booked using gross accounting (~15% distribution fee)3 Excludes SPTI networks in investing stage 4 Includes production-related overhead only (~50% of total SPT overhead) 5 Total international networks capital investment 6 Excludes $8.8 million of Corporate OH per year
Economic Overview—SPE Digital Businesses Revenue ($M) / Margin (%) Averagemargin FY06E capital investment2 FY06E operating income FY03 FY04 FY05 FY06E Line of business $0 $6 Mobile entertainment1 $1 -177.4% $5 47.0% $9 21.0% $7 2.0% 13.8% $14 $48 Video games (SOE)3 $86 -6.0% $136 10.4% $150 11.7% $154 9.3% 7.8% $82 -11.6% $143 9.1% $119 -6.2% $214 7.0% 2.0% $15 $19 Imageworks Animation n/a n/a n/a n/a n/a n/a $94 Total Digital $169 -9.6% $284 10.4% $278 4.3% $375 7.9% 5.0% $29 $167 1 “SPD contribution margin” before pass-through to film, TV businesses; capital investment is Digital Sales/Marketing development expenses 2 Includes Production, Development, and Acquisition Spending, Capital Expenditures and Strategic Investments3 Margin excludes SCEA royalty
SPE 2003-2006E P&L 1 Based on October 2005 forecast
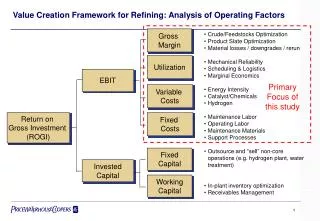
Narrow focus Optimize current assets Diversify Strategic Options for SPE Options Description Advantages Disadvantages 1 • Maintain current portfolio of businesses • Continue to pursue incremental growth opportunities • Periodically optimize capital allocation among businesses • Lowest risk strategy • No acquisitions/divestures required • Limited change required • Assumes that SPE’s current mix of businesses is optimal 2 • Define SPE’s core businesses/competencies • Divest non-core businesses and invest proceeds in core • Enables SPE to realize value from peripheral businesses for investment in core businesses • Increased focus of management attention, resources and capital • Increased financial volatility • Potential to adversely impact growth and/or margins 3 • Execute substantial acquisitions in strategic area(s) that strengthen SPE and Sony • Potential to improve margins and growth • Potential to help to smooth revenue/earnings • Significant capital required
Optimize Current Assets – Potential Actions • Continue to incrementally increase investment in areas with attractive growth prospects and relatively high margins • International networks • Screen Gems • TV production • Animation • Acquisition/DTV films • Mobile gaming • Evaluate potential to improve SPE growth and margins through reallocation of capital between businesses
Narrow Focus – Potential Actions • Define areas of SPE competitive advantage • Motion picture production/distribution • Television production/distribution • International networks • Divest areas outside of SPE core focus • GSN stake • Digital businesses (SOE, Imageworks, SPA) • Game show and daytime soap annuities • Use capital realized from divestures to strengthen core business
Diversify – Potential Actions • Invest $2 to $4 billion to build a substantial presence in aggregation, distribution and services businesses that complement the core business • Potential targets may include • Starz/Encore ($900M - $1.2B) • Netflix ($1.2B1) • Tivo ($350M1) • BitTorrent (~$100M based on rumored funding round valuation) • Consider divesting non-core assets to help fund new investments • SPE stake in GSN ($300-$400M) • Digital businesses • SOE ($500M) • SPA/Imageworks ($500M) • Game show and daytime soap annuities ($1.1 - $1.3B) • Evaluate potential to leverage partial acquisitions/joint ventures to increase diversification while managing capital outlay 1 Enterprise Value
Potential Acquisitions Would Create a Bridge Between Sony Content and Devices SPE Content Distribution/aggregation Sony Devices Potential: IP and traditional
Potential Acquisition Overview of Entertainment Landscape Potential Divestiture
Appendix • Company profiles • Industry value chain • Industry economics • SPE financials
Starz Entertainment Group (SEG) Overview Company Overview: • Largest provider of premium movie services offering 13 digital movie channels • Starz (7 thematic movie channels): 14.1 million homes • Encore (6 thematic movie channels): 24.9 million homes • Also provides advanced services • Vongo: subscription movie download service beta launched in January 2006 • Over 1,000 movies and a live streaming Starz TV channel for $9.99 per month • VOD rental available for $3.99 • Starz On Demand: provides impulse viewing of SEG films as part of monthly subscription • Starz HDTV: high definition version of Starz service Financial/Operating Statistics CY ’04: • Valuation: $928M - $1,237M (as estimated by analysts) • Revenue: $963M • EBITDA: $211M • EBIT: $148M • Multichannel distribution as a % of Starz’ revenue: • Comcast (24.2%), DirecTV (23.6%), Echostar (11.3%), Time Warner (9.7%), Other (31.2%) Recent News: • January ’06: Launched ‘Vongo’, a $9.99/month subscription movie download service that will include more than 1,000 movies, short films and programs • June ’05: Starz and Comcast agree to offer 1,500 movies a year to Comcast’s ON DEMAND service at no extra charge to Starz subscribers • April ‘05: Signed affiliation agreement with Verizon FiOS TV providing carriage for all 13 Starz movie channels
Netflix Overview Company Overview: • Largest online DVD subscription service • Standard subscription plan allows subscribers to have 3 titles at a time for $17.99/month • Provides access to library of 35,000 movie, TV and other filmed entertainment titles • Distributes 1 million DVDs per day from 37 shipping centers in the U.S. • Personalization and recommendations based on database of 1 billion movie ratings from customers Financial/Operating Statistics CY ’05: • Market Cap: $1,382M (as of January 19, 2006) • Revenue: $688M (EV/Revenue multiple: 1.8x) • EBITDA: $115M (EV/EBITDA multiple: 10.5x) • EBIT: $8M (EV/EBIT multiple: 158.0x) • Cash and Equivalents: $212M • LT & ST Debt: $0M • Subscribers (End of Period): 4.2M • ARPU per month: $16.89 • Average Monthly Churn: 4.3% Recent News: • January ’06: Former Postmaster General named COO • May ’05: Agreement to promote Wal-Mart online movie sales business in return for Wal-Mart promoting Netflix online DVD rental business • September ’04: Agreement between TiVo and Netflix to work together to develop a joint entertainment offering (Details and current status are unknown)
TiVo Overview Company Overview: • Provider of technology and services for digital video recorders (DVRs) • Subscription-based service provides consumers with easy way to record, watch, and control TV • Technology supported by portfolio of intellectual property rights that enables TiVo to offer DVR software, hardware, and service solutions to customers like DirecTV, Pioneer, Toshiba, etc. • Began offering advanced home media features with TiVo Series2 DVR connected to a home network • Features include digital music and photos, multi-room viewing • TiVoToGo offers ability to transfer recorded programs from TiVo DVR to a PC or portable device Financial/Operating Statistics CY ‘04: • Market Cap: $465M (as of January 19, 2006) • Revenue: $172M (EV/Revenue multiple: 2.1x) • EBITDA: -$71M • EBIT: -$76M • Cash and Equivalents: $106M • LT & ST Debt: $5M • Subscribers (End of 3Q ‘05): 3.0M • Standalone subs: 1.3M ($8.80 Monthly ARPU) • DirecTV subs: 2.7M ($1.15 Monthly ARPU) Recent News: • December 2005: TiVo rolled out online services to broadband connected TiVoSeries2 DVR • View/share photos with Yahoo! Photo, browse movie information and purchase tickets via Fandango, listen to internet radio via Live365 • November 2005: Enhanced TiVoToGo feature that allows subscribers to easily transfer recorded TV programming to Apple iPod or Sony PSP devices • November 2005: Announced plans to offer television-based advertising search solution by Spring 2006 allowing subscribers to access targeted advertising on an opt-in basis • May 2005: TiVo and Comcast announced strategic partnership
BitTorrent Overview Company Overview: • Cooperative distribution technology that makes downloading more efficient • Assembles digital movies and other computer files from separate bits of data downloaded from other computer users across the internet • Decentralized nature makes downloading more efficient by reducing bandwidth and server costs • Red Hat, Sun Microsystems, NASA, PBS, and Blizzard Entertainment currently use BitTorrent for digital distribution Financial/Operating Statistics: • Rumored $100M pre-money valuation • Used by an estimated 50 million users (worldwide) Recent News: • Q1 2006: Plans to open online marketplace for digital content • Video (film, documentary, television, music video) • Subscription ($20/month): unlimited access to television, catalog films, and some new release movies • Pay-per-download 30 day video rental: $3 new release, $2 catalog • Ad-supported video • Audio (music, podcasts, live recordings, ancillary video) • Games (hardcore videogames, MMOGs) • Software (applications, operating systems, updates/patches) • November 2005: Agreement with MPAA that the founder of BitTorrent will remove Web links to pirated versions of movies from bittorrent.com upon notification from a movie studio • September 2005: Raised $8.75 million in venture funding from DCM (Doll Capital Management) to be used for product development
Appendix • Company profiles • Industry value chain • Industry economics • SPE financials
Production Aggregation Distribution Services Overview of Value Chain – Film and Television Content Studios Film Exhibition (AMC, GCC, Loews) Mainstream (Universal, Disney, Fox, Warner, Columbia) Retailer (Wal-Mart, Best Buy, Costco) Genre (Lions Gate, Screen Gems, Sony Classics) Rentailer (Blockbuster, Movie Gallery) Data Services (Rentrak, Nielsen, Supercomm) Animation (Pixar, Dreamworks, SPA) PPV/VOD Aggregator(inDemand, TVN) Cable/Satellite Distribution(Comcast, DirecTV, DISH) Premium pay channels(HBO, Starz/Encore, Cinemax) Mobile/IP Distribution (Verizon, Cingular, Sprint) Internet (Netflix, MovielinkGoogle, AOL, iFILM) Television TV Production Broadcast Networks(ABC, NBC, CBS, FOX, UPN) Time-shifting services (TIVO) Network (Warner, Buena Vista, Touchstone, Fox, CBS) Cable/Satellite Distribution(Comcast, DirecTV, DISH) Audience Measurement (Nielsen) Cable Networks (FX, Food, Nickelodeon, MTV, AXN) Independent (Carsey-Werner,SPT, Brillstein-Grey, Avenue) Cable/DSL IP Access(Verizon, SBC, Comcast) Premium pay channels (HBO,Showtime, Starz) Kids (Nicktoons, Disney, HIT Entertainment, DIC) Mobile Entertainment(MobiTV, Jamdat) Mobile IP Access (Verizon, Sprint, Cingular) Reality (Mark Burnett) Internet Video(AOL, Google, Yahoo, iTunes) Sports (ESPN, Fox, CBS,ABC, NBC) SPE Presence (operating control)
Production Aggregation Distribution Services Overview of Value Chain – Games and Internet Content Game Development Games Retailer (Wal-Mart, Best Buy, EB Games, Game Stop) Console/PC/Online (EA, THQ, VU Games, Activision, SOE) Rentailer (Blockbuster) Online (EAGames, WorldofWarcraft, Station.Sony) Internet Audience Measurement (Nielsen/Net Ratings) Portals (Yahoo, Google, MSN, AOL) Dial-up IP Access(AOL, Net Zero) Community(MySpace, Linked In) DSL IP Access (Verizon, SBC) Content(iFILM, ESPN.com, CNN.com, IGN, Atom Films) Cable IP Access(Comcast, Time Warner) E-Commerce(eBay, Movielink, Bit Torrent) SPE Presence (operating control)
Appendix • Company profiles • Industry value chain • Industry economics • SPE financials
Motion Pictures Television Production & Distribution International Networks Cable/Satellite Distribution DomesticNetworks Summary of SPE and Industry Economics for Relevant Businesses Market Estimates SPE (ex. Overhead)1 Avg. 2003-05EMargin (EBITDA) Avg. 2003-06EMargin (EBITDA) 2003-05ERevenue CAGR% 2003-06ERevenue CAGR% Mainstream 6%3 (6%) 6%2 (2%)2 Genre 22%3 34% CG Animation 50% 12% n/a n/a Domestic 15% (3%) 15%4 7% International n/a n/a 8% 19% Broadcast 13% 5% n/a n/a Cable 47% n/a 14% n/a Pay Channels 28% n/a 7% n/a Thematic 18% 17% 18%5 11% 30% 12% n/a n/a 1 Excludes Corporate Overhead, totaled $272 M (4% of Rev.) in FY05 2 New Release films (excludes 2nd cycle revenues) 3 Based on Ultimates; excludes marketing and distribution overhead 4 Excludes made-for-syndication, 3rd party distribution, and daytime TV production 5 SPTI established networks margin
Special Effects Mobile Distribution Games Summary of SPE and Industry Economics for Relevant Businesses Market Estimates SPE (ex. Overhead)1 Avg. 2003-05EMargin (EBITDA) Avg. 2003-06EMargin (EBITDA) 2003-05ERevenue CAGR% 2003-06ERevenue CAGR% 23% 17% 8%2 22% 35% 15% 14% 98% n/a n/a 2% 38% 1 Excludes Corporate Overhead, which totaled $272 M in FY05 2 Margin excludes SCEA royalty
Viacom Average Time Warner Disney Fox Overview of Industry Film Margins: Major Studios FY03-05E Average EBITDA Margin New Release* Library* Overall Studio 10.6% 20.9% 14.1% 7.0% 34.7% 14.2% 1.6% 23.5% 6.4% 1.7% 28.8% 12.5% 11.3%** 5.5%** 25.1%** * Industry analyst estimates define library as syndication TV window and catalog DVD** Weighted average Source: Morgan Stanley
Specialty CG Animation Overall market Overview of Industry Film Margins: Variations by Feature Type Average Domestic B.O. CY05 EBITDA margin Feature type ~$8M* 16.9%** ~$200 M 50.1%*** ~$27M* 11.0%**** * CY04 averages ** Based on Lion’s Gate *** Weighted average of FY04-05E EBITDA margins for DreamWorks, Pixar **** Average of CY05 for Paramount, Warner, Disney and CY04 Fox Source: JPMorgan, Morgan Stanley
Viacom Viacom Time Warner Total Disney Fox Overview of Industry Television Production Margins: Major Studios FY03-05E Avg. EBITDA Margin Primetime Syndication Overall Studio -27.7% 31.1% 12.4% -16.7% 47.1% 18.8% -19.5% 29.7% -5.2% -25.3% 36.1% 20.7% -22.3%* 36.0%* 15.3%** * Un-weighted average ** Weighted average Source: Morgan Stanley
UPN Average CBS WB ABC FOX Viacom Overview of Industry Broadcast Network Margins: Major Players Broadcast Networkand Stations FY03-05E Revenue CAGR FY03-05E Avg EBITDA Margin 16.6% 5.6% -0.8% 13.6% 5.0% -1.3% 18.8% 9.3% 12.2% 7.7% 12.7%* 4.6%* * Weighted average Source: CSFB
Average Discovery Communications(Domestic Networks) AMC** Scripps Network(HGTV, Food Network, DIY Network, Fine Living) MTV Networks(MTV, Nickelodeon, VH1, Comedy Central, Spike TV) IFC** Turner Networks(Cartoon Network, CNN, TBS, TNT, TCM) Overview of Industry Cable Network Margins: Major Players Domestic CableNetworks FY03-FY05E Revenue CAGR FY03-FY05E Avg EBITDA Margin 54.5% 32.1% 49.1% 19.0% 48.2% 6.8% 44.0% 4.9% 36.9% 14.0% 36.6% 19.0% 47.0%* 14.2%* * Weighted average** Owned by Rainbow Media, a subsidiary of Cablevision Source: CSFB
Starz HBO Showtime Average Overview of Industry Premium Pay Channel Margins: Major Players FY03-FY05E Revenue CAGR FY03-FY05E Avg EBITDA Margin Premium Pay Channel 6.4% 26.5% 6.6% 30.7% 6.1% 20.0% 6.5%* 27.5%* * Weighted average Source: CSFB
Average SPTI Int’l Networks Discovery Communications (International Networks) Viacom International Networks M6 Thematic Channels (France) Overview of Industry International Networks: Major Players International ‘Cable’ Network FY03-FY05E Avg. EBITDA Margin FY03-FY05E Revenue CAGR 20.2% 11.6% 17.4% 20.8% 7.6%* 38.3% 18.3%** 16.9%** 10.5%*** 10.5%**** * Operating margin** Weighted average*** FY03-06E Average EBIT margin used to account for minority interest **** FY03-FY06E Revenue CAGR Source: Morgan Stanley, CSFB, SPE Corporate Finance
Average SOE Electronic Arts THQ Activision Take Two Viacom Overview of Industry Interactive Gaming Margins: Major Players Game Developer/Publisher FY03-FY05E Revenue CAGR FY03-FY05E Avg. EBITDA Margin 26.7% 12.3% 22.5% 27.2% 23.2% 27.6% 13.6% 11.5% 16.5%* 22.9%* 21.6%** 2.5%** * Weighted average ** FY03-FY06E Source: Morgan Stanley, Citigroup, SPE Corporate Finance
Cingular Verizon Sprint-Nextel Average Overview of Industry Mobile Distribution Margins: Major Players FY03-FY05E Revenue CAGR FY03-FY05E Avg EBITDA Margin Mobile Carrier 13.2% 29.0% 16.6% 38.2% 15.6% 36.3% 15.4%* 35.3%* * Weighted average Source: JP Morgan, CSFB
Charter Cablevision Comcast DISH Average DirecTV Time Warner Overview of Industry Cable/Satellite Margins: Major Players FY03-FY05E Revenue CAGR FY03-FY05E Avg. EBITDA Margin MSO/DTH Player 38.8% 4.9% 38.7% 10.9% 38.5% 10.1% 37.5% 8.9% 18.0% 17.7% 14.4% 9.6% 11.5%* 29.6%* * Weighted average Source: Morgan Stanley, Citigroup, Bloomberg
Appendix • Company profiles • Industry value chain • Industry economics • SPE financials
SPE 2003-2006E P&L 1 Based on October 2005 forecast