Download
1 / 28
280 likes | 612 Views
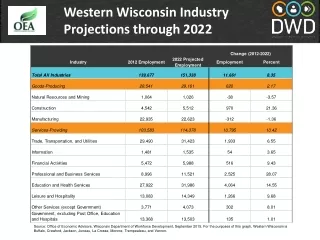
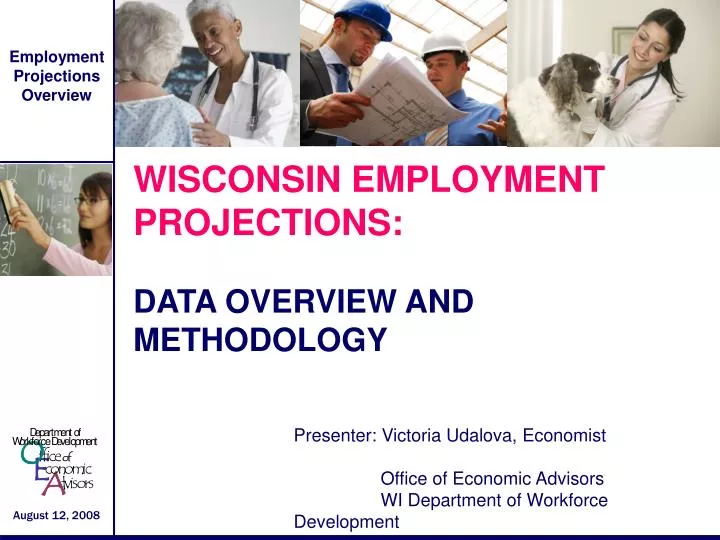
WISCONSIN EMPLOYMENT PROJECTIONS: DATA OVERVIEW AND METHODOLOGY. Presenter: Victoria Udalova, Economist Office of Economic Advisors WI Department of Workforce Development. What is available?. Geographic Areas: Statewide Workforce Development Areas (11 areas).

E N D
WISCONSIN EMPLOYMENT PROJECTIONS:DATA OVERVIEW AND METHODOLOGY Presenter: Victoria Udalova, Economist Office of Economic Advisors WI Department of Workforce Development
What is available? Geographic Areas: • Statewide • Workforce Development Areas (11 areas)
What is available? (cont.) Long-Term: • 10 years • Updated Every 2 Years Short-Term: • 2 years • Updated Every Year
What is available? (cont.) Industries: • 90 Industries • Across All Occupations Occupations: • 800 Occupations • Across All Industries Industry-Occupation Matrix: • Occupations by Industries • Industries by Occupations
Industry-Occupation Matrix HOSPITALS REGISTERED NURSES Registered Nurses Hospitals Offices of Physicians Surgeons Nursing Homes Receptionist Industries by occupation Occupations by industry
Classification System • Industries • NAICS Codes: six-digit hierarchical coding system • http://www.census.gov/naics/2007/NAICOD07.HTM • Occupations • SOC Codes: 821 detailed occupations • http://www.bls.gov/soc/socguide.htm#LINK2 • http://online.onetcenter.org/
When is Data Available? Long-term: Summer of Even Years Short-term: Every Summer 2006-2016 statewide projections were released in June 2008 Regional projections usually released a few months after statewide projections are released
Notifications List • Great way to always know when new data/report/publication is available • You receive an email notifying you what is available • Contact me if you want your name/email address to be included in this list
What we do and don’t project… • We project the number of jobs that will be filled in the projected year • We don’t project worker shortage, supply, or demand
Fundamental Questions • Looking back, how have economic, technological, demographic, social, and political forces shaped employment? • How will these forces change in the future? • What are the consequences of these changes for future employment levels?
Inputs DATA • Current Employment Statistics (CES) • Quarterly Census of Employment and Wages (QCEW) • Occupational Employment Statistics (OES) • Decennial Census • Current Population Survey (CPS) • National Employment Projections • US Bureau of Economic Analysis (BEA)
Inputs KNOWLEDGE AND INSIGHT • Victoria • OEA Staff • Panel Members • US Bureau of Labor Statistics Staff • Other States’ Projections Staff
Industry Projections Historic Employment Econometric Models Panel Members Input OEA Economist
Industry Projections • Number of Jobs in 2006 & 2016 • Numeric Job Growth between 2006 & 2016 • Percentage Change in Jobs between 2006 & 2016
Occupational Projections Industry projections are control totals Occupational Employment Survey Staffing pattern Industry Projections BLS change factors & replacement rates Projected National Trends OEA Economist
Establish Base Year Staffing Pattern for Each Industry
Establish Projected Year Staffing Ratios for Each Industry
Establish Projected Year Staffing Pattern for Each Industry
Estimate Replacement Openings • Calculate total number of jobs in each occupation across all industries, in the base year • Apply BLS Replacement Rates (uses CPS) to the total to estimate replacement openings during the projection period • NOTE: Replacement openings are for occupations across all industries
Occupational Projections • Number of Jobs in 2006 & 2016 • Numeric Job Growth between 2006 & 2016 • Percentage Change in Jobs between 2006 & 2016 PLUS • Annual Average New Jobs • Annual Average Replacement Openings • Annual Average Total Job Openings • Typical Education and Training Path • Wages (average annual, entry, and experienced)
But even in the best of circumstances our knowledge is incomplete … • Shocks • New, previously unknown, industries and occupations may appear • Industries and occupations that exist elsewhere, but not previously in Wisconsin, may appear
Fundamental Question of Projections Are you willing to be wrong?
Where is Data? • OEA Website: http://dwd.wisconsin.gov/oea Click on Employment Projections link or look under OEA Products • WORKnet Website: http://worknet.wisconsin.gov Click on Data Analyst Data Tables
National Projections (BLS) • Available at http://www.bls.gov/emp • Long-term 10-year projections only • Updated every 2 years • Latest data is for the 2006-2016 period • Industries, Occupations, and Industry-Occupation matrix data are available
National Projections (BLS) • Occupational Outlook Handbook (expected job prospects, training & education, etc.) http://www.bls.gov/oco • Career Guide to Industries (expected job prospects, occupations in the industry)http://www.bls.gov/oco/cg
For more information contact: Victoria Udalova Victoria.Udalova@dwd.state.wi.us (608) 267-9607 http://dwd.wisconsin.gov/oea