Download

1 / 27
270 likes | 274 Views
This summary presents the results of a survey conducted among LTC administrators. It highlights their demographics, challenges in their roles, job satisfaction, and future intentions.

E N D
BELTSS Member Survey 2019 Summary of Results
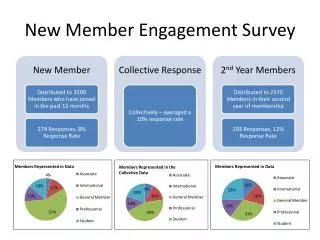
Responses • 700 of 1904 for 36.8% response rate! • Open for 3 weeks • Not designed by researcher • Intentionally asked 3 open ended questions that require further analysis
Gender • 38% female • 61.1% male • 0% fluid, non-binary • 0.9% prefer not to answer
Disability • 95.3% report no disability • 2.3% prefer not to answer • 2.0% have a disability and manage without accommodations • Less than 1% have disability accommodated by employer
Path to Licensure • 72.3% completed AIT • 21.5% graduated from accredited university • 6.1% transferred from another state
Current job • 62.9% are currently in a job that requires their license • 5.5% unable to find job • 11% changed jobs within LTC • 4.7% not working in LTC • 15.4% other – AL, retired, etc.
LNHA of record • 56% of respondents are listed as administrator of record at one facility • 4.2% are administrator of record at 2 facilities • 40% chose “other” – primarily not working at LNHA or not listed as LNHA of record at any facility
Job satisfaction last 12 mo • 23.8% increased • 42.4% stayed the same • 30.3% decreased
Involuntary unemployment • 12.7% experienced involuntary employment in last two years • 4% ownership changes • 7.7% “other” – census, bad mgt, ownership change, unknown
Greatest challenges Most significant and difficult to manage • #1 Recruiting and retaining quality staff (76%) • #2 Regulatory compliance • #3 Meeting performance expectations • #4 Reimbursement rates
Greatest Challenges Routine but significant challenge • #1 Survey process • #2 Family satisfaction • #3 Consumer satisfaction • #4 Fiscal management
Greatest challenges Routine & not particularly difficult • #1 Compensation • #2 Negative stigma of nursing homes • #3 Fiscal management • #4 Liability or risk of litigation
Greatest challenges Easier aspects of the job • #1 Lack of adequate support from employer • #2 Compensation • #3 Consumer satisfaction • #4 Negative stigma of nursing homes
Why? Most important reason you work as LNHA • Approximately 43% responded with an answer that put consumers first – making a difference, impacting lives of seniors in need, providing quality of care/life, etc.
Change one thing? • Staff – quantity, quality, wages • Regulation – too much oversight • Survey process - punitive
How better train & support • Make my life easier • All geared toward reducing expectations of the job • Regulations • Pressure • Financial goals • Too many responsibilities
Summary • Profession of white men age 40-59 licensed through AIT, 62% in job that requires license • Majority licensed more than 16 years but in current job 1-5 years • Satisfaction is steady • 42% intend to remain in the field