Download

1 / 36
380 likes | 649 Views
Planning a Successful “Round Robin”. Can You Measure It?. Paul Schiffelbein ASTM Committee Week 14 June 2006. Overview. Measurement system analysis (Round robin, Interlaboratory Study (ILS), Interlaboratory Comparison (ILC), Gage Study) description, definitions and motivation

E N D
Planning a Successful “Round Robin” Can You Measure It? Paul Schiffelbein ASTM Committee Week 14 June 2006
Overview • Measurement system analysis (Round robin, Interlaboratory Study (ILS), Interlaboratory Comparison (ILC), Gage Study) description, definitions and motivation • Round robin guidelines • Round robin logistics • Data Analysis • Precision and bias statement
Purpose of Measurement System Analysis • Ensure the measurement system has adequate accuracy: precision and bias • Identify sources of measurement variation (and make improvements, if necessary) • Compare several test devices, test methodologies, test locations (linearity, bias, sensitivity) • Quantify measurement variability for reference
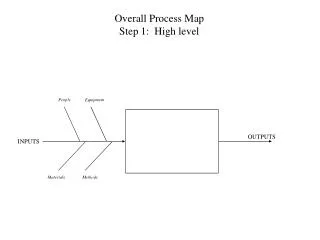
Measurement Process Variation Observed Process Variation Actual Process Variation Measurement Variation Variation due to Labs, Operators, Devices, Time Variation due to Gage Long-term Process Variation Short-term Process Variation Variation within a Sample Bias “Short-term” “bias” “Long-term” Linearity Stability Simple “precision”
ISO 5725-1, ASTM E177 • Accuracy: The closeness of agreement between a test result and the accepted reference value • “Accuracy,” when applied to a set of test results, involves a combination of random components and a common systematic error or bias component • Bias: the difference between the expectation of test results and an accepted reference value • Bias is the total systematic error as contrasted to random error. There may be one or more systematic components contributing to the bias.
ISO 5725-1, ASTM E177 • Precision: The closeness of agreement between independent test results obtained under stipulated conditions. • Precision depends only on the distribution of random errors and does not relate to the true value or the specified value. • Precision can be decomposed into short- and long-term (or narrow and wide) components. Repeatability and reproducibility are used to quantify this concept.
ISO 5725-1 Repeatability: Precision under repeatability conditions • independent test results • the same test method • identical test items • the same laboratory • the same operator • the same equipment • within short time interval • Repeatability standard deviation: The standard deviation of test results obtained under repeatability conditions • Repeatability limit (“r”): the absolute difference between two test results obtained under repeatability conditions should be less than or equal to this value
ISO 5725-1 Reproducibility: Precision under reproducibility conditions • independent test results • the same test method • identical test items • different laboratories • different operators • different equipment • longer time interval • Reproducibility standard deviation: The standard deviation of test results obtained under reproducibility conditions • Reproducibility limit (“R”): the absolute difference between two test results obtained under reproducibility conditions should be less than or equal to this value
ASTM/ISO Usage Observed Process Variation Actual Process Variation Measurement Variation Variation due to Labs, Operators, Devices, Time Variation due to Gage Long-term Process Variation Short-term Process Variation Variation within a Sample “Short-term” “repeatability” Bias “bias” “Long-term” “reproducibility” Linearity Stability Simple
Gage R&R/Auto Industries Usage Observed Process Variation Actual Process Variation Measurement Variation Variation due to Labs, Operators, Devices, Time Variation due to Gage Long-term Process Variation Short-term Process Variation Variation within a Sample “Short-term” “repeatability” “Long-term” “reproducibility” Bias “bias” Linearity Stability Simple “Gage”
Round Robin Guidelines • E 691 “Standard Practice for Conducting an Interlaboratory Study to Determine the Precision of a Test Method” • D 2904 “Standard Practice for Interlaboratory Testing of a Textile Test Method that Produces Normally Distributed Data”
Round Robin Guidelines • The design should be as simple as possible in order to obtain estimates of within- and between-laboratory variability that are free of secondary effects • Study should include a minimum of five laboratories • A minimum of two operators should be used per laboratory • When multiple instruments within a laboratory are used, tests must be made on all equipment to establish the presence or absence of the equipment effect.
Logistics: D 885 Case Study • Motivation: The current version of D 885 was written for traditional tensile testing machines. Automated tensile testers are now being used in high-tenacity fiber testing, and need to be included in this standard. The current study will include three types of automated testers, as well as parallel testing on traditional tensile test devices. The objective of this study is to quantify test precision of traditional and automated testers, as well as any bias seen between the device types. The study will only address aramid materials.
Logistics: D 885 Case Study • Responsibility: Task group D13.19 (Tire Cord and Fabrics) has overall responsibility of the ILS. Dawn Caullwine (chair) will act as overall coordinator for conducting the ILS. The coordinator will supervise the distribution of materials and protocols to the laboratories and receive the test result reports from the laboratories.
Logistics: D 885 Case Study • Study Design: Nine materials will be tested on each of three types of automated tensile test devices. Two devices of each type will be used. Yarn will be supplied in pre-twisted state for testing. Untwisted yarn will also be provided to Statimat labs, so testing can be performed both on pre-twisted yarn, and yarn automatically twisted by the test machine. Two laboratories will also test the materials using traditional methods for reference. Each of those laboratories will use two operators.
Logistics: D 885 Case Study • Materials: The ILS will include the following nine materials (All samples are shipped twisted and ready to test, except for Statimat laboratories, which receive both twisted and untwisted samples): • Kevlar®: 195 denier • Kevlar®: 600 denier • Kevlar®: 1140 denier • Nomex®: 200 denier • Nomex®: 1600 denier • Technora®: 550 denier • Twaron: 840 denier • Twaron: 1500 denier • Twaron: 3000 denier
Logistics: D 885 Case Study • Test Determinations and Test Results: The number of test determinations required for a test result is specified in each individual test method. For the purpose of this study, each laboratory will make one hundred (100) determinations (breaks) for each material.
Logistics: D 885 Case Study • Test Determinations and Test Results: The following properties (and associated measurement units) will be recorded: • Break strength (BS) N • Elongation at break (EB) % • Modulus between 300 mN/tex and 400 mN/tex (MOD) CN/tex • FASE @ 0.3% N • FASE @ 0.5% N • FASE @ 1.0% N Use nominal linear density for modulus calculation.
Logistics: D 885 Case Study • Details: The test method being studied is D885-03. Specify the type of equipment used, including manufacturer, model, and software program. Samples should be conditioned as per D885 7.1 to moisture equilibrium in an environmentally controlled room for a minimum of 16 hours, at RH 55 +/- 2% and temperature 24 +/- 1 degrees C (72 +/- 2 degrees F). Specific for Para-Aramid: • Gauge length: 500mm • Crosshead rate: 250mm/min. (50%) Etc.
Logistics: D 885 Case Study • Data: Data should be entered into the Excel workbook provided. Label the workbook with your laboratory name, fill in the test data, and send the completed file to: Paul Schiffelbein DuPont Engineering, Quality Management & Technology paul.a.schiffelbein@usa.dupont.com 302/774-2417
A Better Way?: Internet Entry for F 2130 RR Figure courtesy of Dr. Anugrah Shaw, UMES
Logistics: D 885 Case Study • Data Analysis:
Logistics: D 885 Case Study • Data Analysis:
Repeatability and Reproducibility Use between- and within-laboratory variance components: sR = s2L + s2r Where: sR is the reproducibility standard deviation sr is the repeatability standard deviation sL is the square root of the inter-laboratory (device, operator, etc.) variance component
Logistics: D 885 Case Study • Data Analysis: Repeatability variance Reproducibility variance (one estimate) Reproducibility variance (another estimate)
Logistics: D 885 Case Study • Precision and Bias Statement:
Logistics: D 885 Case Study • Precision and Bias Statement:
Logistics: D 885 Case Study • Precision and Bias Statement:
Logistics: D 885 Case Study • Precision and Bias Statement:
Logistics: D 885 Case Study • Precision and Bias Statement:
Summary • Explicitly state objectives for your study, and make sure all participants understand them • Write protocol covering responsibilities, timing, samples and sample handling, test equipment and set-up, sampling plan, properties, units, etc. • Details are important! Be specific, explicit, and discuss ahead of time with task group to avoid surprises. Communicate! • Set up data collection to be as “goof proof” as possible, and to facilitate subsequent analysis