Download
1 / 28
290 likes | 585 Views
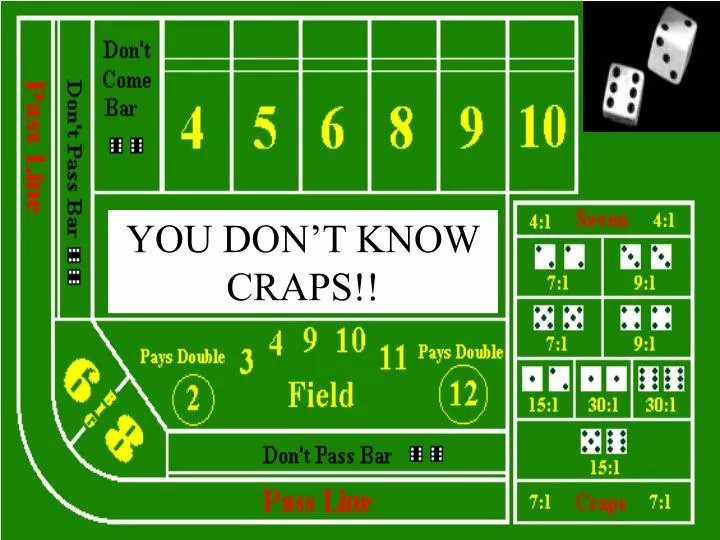
YOU DON’T KNOW CRAPS!!. An Investigation Using Probability, the Geometric Distribution, and Expected Returns for the Game of Craps. By Otto Magdanz and Chip Malt. Overview. A brief overview describing what craps is and how it is played. This presentation will cover:.

E N D
An Investigation Using Probability, the Geometric Distribution, and Expected Returns for the Game of Craps By Otto Magdanz and Chip Malt
Overview • A brief overview describing what craps is and how • it is played. This presentation will cover: • An overview of the geometric distribution and how it is used. • The derivation of an equation which can be used to • calculate the probabilities of different outcomes in craps. • A brief overview of the rules of probability. • Sample calculations and results using our equation. • An overview of the concept of expected returns. • Sample calculations and results of the expected returns.
What is Craps? • Craps is a casino game played on a table (shown on the opening page) which uses two dice. • Bets are placed on the outcome of the rolls. • The outcome is determined by the sum of • the two dice.
Craps: Basic Rules - Numbers are obtained by rolling two dice and adding the values which they display. - The numbers 4, 5, 6, 8, 9, and 10 are called the points. - A round begins when one of these points is rolled. - The round ends when either that same number or a 7 is rolled. - Rolling the point is a win. - Rolling a 7 is a loss.
Remember: The Geometric Distribution The geometric distribution is used to calculate the probability that the first success comes on a specific trial. The cumulative geometric distribution is used to calculate the probability that the first success comes on or before a specific number of trials. The equation used for the geometric distribution is: P(first success on nth trial) = P(success) * P(not success)n-1
P(first success on nth trial) = P(success) * P(not success)n-1 Note: • In this project, because we are calculating the probability that the round will be lost by rolling a 7, rolling a 7 is considered a success in this equation. • In this project, a failure (not success) on a given roll is having the round continue for another roll.
In our calculations we are using the geometric distribution, only with one important distinction: • The probability of a failure is the probability of not rolling the point or a 7, because both will end the round. • This is different from the simple geometric distribution because the probability of a failure is not 1-P(success).
In order to calculate the probability of losing, we developed the following equation: Note that it looks very confusing but will be explained later and you need not spend any time trying to figure it out P(7 before the point) = P(7) + (P(not point or 7)1 * P(7)) + (P(not point or 7)2 * P(7)) + (P(not point or 7)3 * P(7)) + … + (P(not point or 7)∞ * P(7)) Although it may not appear to be, this equation is simply a slightly modified version of the cumulative geometric distribution. This will be explained on the following slide.
The Equation: Explained P(7 before the point) = P(7) - The probability of rolling a 7 on your first roll and losing immediately is displayed as follows...
The Equation: Explained P(7 before the point) = P(7) + (p(not point or 7) 1 * p(7)) + - This is the probability of not winning or losing on your first roll (not rolling the point or a 7) and then losing on your second roll by rolling a 7.
The Equation: Explained P(7 before the point) = P(7) + (p(not point or 7) 1 * p(7)) + (p(not point or 7) 2 * p(7)) - This is the probability of rolling something other than the point or a seven on your first two rolls (thus continuing the round) and then losing on your third roll.
The Equation: Explained P(7 before the point) = P(7) + (p(not point or 7) 1 * p(7)) + (p(not point or 7) 2 * p(7)) + (p(not point or 7) 3 * p(7)) + - This is the probability of not winning or losing on your first three rolls and then losing on your fourth roll.
The Equation: Explained P(7 before the point) = P(7) + (p(not point or 7) 1 * p(7)) + (p(not point or 7) 2 * p(7)) + (p(not point or 7) 3 * p(7)) + …+ (p(not point or 7) ∞ * p(7)) - This probability represents that this pattern theoretically can continue on for an infinite amount of rolls.
We will now go through the steps of calculating the actual probabilities using our equation. We will use the roll 4 as the point for this example, however remember that any of the points could be used by simply using their probabilities instead of the probability of rolling a 4.
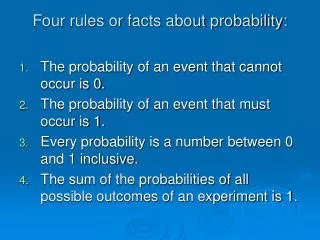
Remember Since everything in this situation is independent, the following probability rules apply: • P(not A) = 1 - P(A) • P(A | B) = P(A) • P(A and B) = P(A) * P(B) • P(A or B) = P(A) + P(B)
Calculating the Probabilities: - Probability of rolling a 7 = (6/36) or (1/6) - Probability of rolling a 4 = (3/36) or (1/12) - So P(7 or a 4) = (6/36) + (3/36) = (9/36) or (1/4) - So P(not 7 or 4) = 1 - P(7 or 4) = (3/4)
Sample Calculation: -Assume a 4 has been rolled to begin the round. -Recall: rolling a 7 before another 4 loses the round and rolling a 4 again before a 7 wins the round. Now we will plug these numbers into our equation step by step: P(losing before winning)= (1/6) + ((3/4)1 * (1/6)) + ((3/4)2 * (1/6)) + ((3/4))3 * (1/6)) + … + ((3/4)∞ * (1/6)) = (2/3) Because the equation goes on forever, we created a program which calculated the final probability for us.
Results This chart displays the probabilities of Winning and losing your point bets for each point: The probability of winning is 1-P(Losing)
Conclusion For Probabilities • In the long run, the probability of winning with each point is the decimal displayed in the previous slide. • These results yield a fairly low overall probability of winning. • One’s highest chance of winning is with a 6 or 8 as the point because they have the greatest probability of being rolled.
Expected Return • Because the whole point of craps is that you are betting money, we will now briefly investigate the expected return for each point bet • The expected return uses probabilities to determine what should be the final outcome in the long run. • The equation for this can be found on the following page
The equation is as follows: Expected Return = (P(winning)*(amount won)) – (P(losing)*(amount lost)) • This equation is a bit more complicated since there are odds depending on the point that is rolled. • This means that the amount you would win is not always equal to the amount you would lose.
- Assuming you put down additional money on your point roll (commonly called “backing up” your bet), the odds are as follows:
Sample Calculations: • Assume a $1.00 bet has been made. • Assume a 4 has been rolled to start the round. • Recall: P(winning when 4 is the point) = .3333 and P(losing when 4 is the point) = .6667 We will now plug the numbers into the equation: Expected Return = P(winning)*(amount won) .3333 * ($1.00 * 2) – P(losing)*(amount lost) .6667 * $1.00 = $0.00 Multiplied by 2 because odds are 2:1 This same calculation would be used for the other points only using different odds. For example if we were using 6 as the point, we would multiply the $1.00 by 6/5 instead of 2, because the odds for a 6 are 6:5.
Expected Returns for Each Point This table shows the expected return for each point using the same procedure as the previous slide demonstrated.
Conclusion For Expected Return • This investigation has shown that, with odds, every point yields an expected return of $0.00. • This means that if you continue to play, in the long run, you should come out even, meaning you do not lose money but you do not win money either. • The fact that craps has even odds often gives it the best odds in the casino. • The reason points with higher probabilities of winning do not have higher expected returns is because their lower odds offset their high probabilities of winning.
Overall Summary • A modified version of the cumulative geometric distribution was used to calculate the probabilities of winning and losing for each point • The calculations using this equation showed that the probabilities of winning on your point bets are all relatively low (below 50%). • The casino provides odds on these points, allowing higher odds for lower probabilities and vice versa, thus giving the gambler an expected return of $0.00.