Download
1 / 25
290 likes | 482 Views
Marker-Assisted Breeding for Apple at the University of Minnesota and Washington State University. Jim Luby , Kate Evans, and Cameron Peace. Outline of Presentation. Timeline and Flow of Apple Breeding Program Developing Useful Markers with the Marker Assisted Breeding Pipeline

E N D
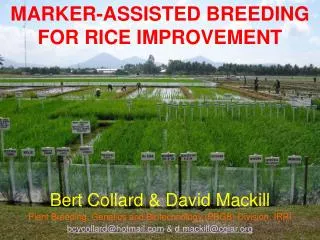
Marker-Assisted Breeding for Apple at the University of Minnesota and Washington State University Jim Luby, Kate Evans, and Cameron Peace
Outline of Presentation • Timeline and Flow of Apple Breeding Program • Developing Useful Markers with the Marker Assisted Breeding Pipeline • Identity Confirmation • Marker-Assisted Parent Selection (MAPS) • Marker-Assisted Seedling Selection (MASS)
Timeline and Flow of Apple Breeding Program
Target Marker-Assisted Parent Selection Target Marker-Assisted Seedling Selection
Developing Useful Markers: Marker Assisted Breeding Pipeline
Genomics Applied in Apple Breeding Target Traits Known QTLs QTL priorities DNA testing services Breeding markers Applications in breeding MAPS MASS Identity Confirmation Simple validation Allele effects& distributions Crossing schemes Seedling selection schemes Trial MASS
Traits and Loci Used at UMN and WSU Linkage group 1 2 3 4 5 6 7 8 9 “A” – Acidity Md-Exp7 – Texture (Scab Resistance) 11 12 13 14 15 16 17 Ma – Acidity, Texture 10 Md-ACS1 – Texture (storage) Md-PG1 – Texture Md-ACO1 – Texture (storage)
Traits and Loci Used at UMN and WSU Linkage group 1 2 3 4 5 6 7 8 9 • “Bl” – Overcolor, blush vs stripe Rf – Overcolor Overcolor 11 12 13 14 15 16 17 10
Traits and Loci Used at UMN and WSU Linkage group 1 2 3 4 5 6 7 8 9 Apple scab resistance Md-Exp7, CHVf1– Scab Resistance (Texture) Photo: M. Clark 11 12 13 14 15 16 17 Ma – Bitter Pit (Acidity, Texture) 10 “Bp13” – Bitter Pit
Traits and Loci Used at UMN and WSU Linkage group 1 2 3 4 5 6 7 8 9 • “Bl” – Overcolor “A” – Acidity Rf – Overcolor Md-Exp7, CHVf1– Texture, Scab Resistance 11 12 13 14 15 16 17 Ma – Acidity, Texture, Bitter Pit 10 “Bp13” – Bitter Pit Md-ACS1 – Texture (storage) Md-PG1 – Texture Md-ACO1 – Texture (storage)
Identity Confirmation • LOTS of opportunities for errors in a breeding program • mislabeled parent trees • pollen collection • crossing • seed harvest and handling • seedling handling and propagation • labeling • Ancestry errors in pedigrees of selections and cultivars • Identity and ancestry for breeding and intellectual property purposes • Parentage of Seedlings • 1% to 5% error rate not unusual in a cross malus
Marker-Assisted Parent Selection
Parent Selection at UMN • Potential parents list - based on • Crossing objectives • Available trees or pollen • Phenotype data • Pedigree • Genotype data and relative breeding value at each locus of interest
Parent Selection at UMN • Prospective cross list • based on favorable phenotype and genotype combinations • Logistics • final crossing “call” made in field based on flowering time, tree availability, pollen quality, etc.
Marker-Assisted Seedling Selection
Seedling Selection: Sample Collection 96 count seedling tray for sample collection Seedling order replicated in 96 well DNA extraction plate Photo by Kate Evans
Seedling Selection: Culling Decisions Culling level set for each allele in each genetic test Genetic tests selected for each cross based on goals and parents
Seedling Selection: Genotype Data Report • Culling decision for each seedling combines all genetic tests • Genotype report color coded • Maintains order in seedling tray to facilitate culling Photo by Kate Evans
Seedling Selection: Culling • Verbal repetition of seedling location and culling instruction to reduce errors • Usually best with three people • Culling requires 2-3 person/hours per 1000 seedlings
Summary • Reliable Markers • Developed for 9 loci and 8 target traits in our germplasm • Functional SNP haplotypes and PCR-based markers (SSR, Indel) • Identity confirmation • RosBREED SNP markers used to confirm ancestry of ~ 900 parents, selections, seedlings and ancestors at UMN, WSU and Cornell • PCR-based Markers used on over 20,000 seedlings at WSU and UMN • Marker-Assisted Parent Selection • Used to design 120 crosses from 2011 through 2013. • Marker-Assisted Seedling Selection • Over 20,000 seedlings screened in 2011 through 2013 • Culling from 25 to 90% depending on cross and markers
Acknowledgements This project is supported by the Specialty Crop Research Initiative of USDA’s National Institute of Food and Agriculture
Cornell Susan Brown KenongXu Clemson KsenijaGasic Gregory Reighard Texas A&M Dave Byrne Univ. of CA-Davis Tom Gradziel Carlos Crisosto Univ. of New Hamp. Tom Davis MSU Amy Iezzoni (PD) Jim Hancock Dechun Wang CholaniWeebadde WSU Cameron Peace Dorrie Main Kate Evans Karina Gallardo Vicki McCracken Nnadozie Oraguzie Former WSU Raymond Jussaume Mykel Taylor Univ. of Arkansas John Clark USDA-ARS Nahla Bassil Gennaro Fazio Chad Finn Univ. of Minnesota Jim Luby Chengyan Yue Oregon State Univ. Alexandra Stone Plant Research Intl, Netherlands Eric van de Weg Marco Bink