Download
1 / 17
170 likes | 264 Views
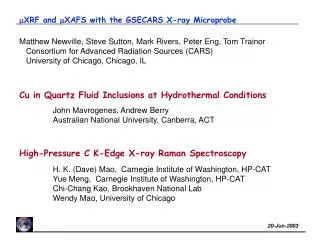
Matthew Newville, Peter Eng, Steve Sutton, Mark Rivers Consortium for Advanced Radiation Sources (CARS) University of Chicago, Chicago, IL. GSECARS X-ray Microprobe for Earth and Environmental Science. Objective for Earth and Environmental Sciences:.

E N D
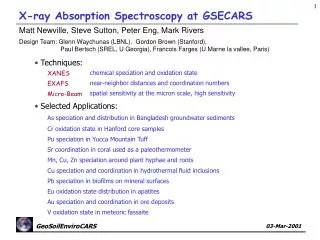
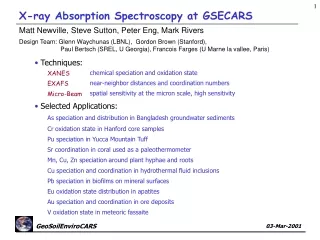
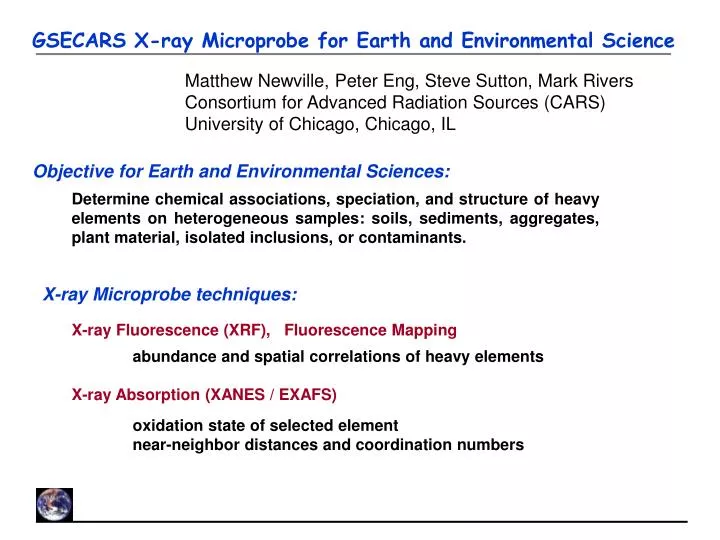
Matthew Newville, Peter Eng, Steve Sutton, Mark Rivers Consortium for Advanced Radiation Sources (CARS) University of Chicago, Chicago, IL GSECARS X-ray Microprobe for Earth and Environmental Science Objective for Earth and Environmental Sciences: Determine chemical associations, speciation, and structure of heavy elements on heterogeneous samples: soils, sediments, aggregates, plant material, isolated inclusions, or contaminants. X-ray Microprobe techniques: X-ray Fluorescence (XRF), Fluorescence Mapping abundance and spatial correlations of heavy elements X-ray Absorption (XANES / EXAFS) oxidation state of selected element near-neighbor distances and coordination numbers
GSECARS XRF/XAFS Microprobe Station Focusing:Kirkpatrick-Baez mirrors: Rh-coated Si, typically using 3x3mm spot sizes, at 50mm from end of mirrors. Incident Beam: LN2 cooled Si (111) Sample Stage: x-y-z stage, 1mm resolution Samples in air or He, typically Slits:typically 200 to 300 mm, accepting ~20% of undulator beam at 50m from source. Data Collection: custom software for XRF, mapping and XAFS, based on EPICS. Optical Microscope: 5x to 50x objective to external video system. Fluorescence detector:16-element Ge detector / DXP electronics, Lytle Detector, or Wavelength Dispersive Spectrometer
Kirkpatrick-Baez Focusing Mirrors The table-top Kirkpatrick-Baez mirrors use four-point benders and flat, trapezoidal mirrors to dynamically form an ellipsis. They can focus a 300x300mm beam to 1x1mm. With a typical working distance of 100mm, and a focal distance and spot-size independent of energy, they are ideal for micro-XRF and micro-EXAFS. We use Rh-coated silicon for horizontal and vertical mirrors to routinely produce 2x3mm beams for XRF, XANES, and EXAFS.
Multi-Element Ge Detector: energy resolution ~250 eV, which separates most fluorescence lines, and allow a full XRF spectrum (or the windowed signal from several lines) to be collected in a second. This is limited in total count rate (to ~250KHz), so multiple elements (10 to 30) are used in parallel. Detection limits are at the ppm level for XRF. XANES and EXAFS can be measured on dilute species (~10ppm) in heterogeneous environments. X-ray Fluorescence Detectors Wavelength Dispersive Spectrometer: has higher resolution (~20eV), and smaller solid angle. This can be used for XAS, and is able to separate fluorescence lines that cannot be resolved with a Ge detector.
Metal Speciation in Hydrothermal Fluid Inclusions 100mm John Mavrogenes, Andrew Berry (Australian National University), GSECARS Hydrothermal ore deposits are important sources of Cu, Au, Ag, Pb, Zn, and U. Metal complexes in high-temperature, high-pressure solutions are transported until cooling, decompression, or chemical reaction cause precipitation and concentration in deposits. To further understand the formation of these deposits, the nature of the starting metal complexes need to be determined. XRF andXAFS are important spectroscopic tools for studying the chemical speciation and form of these metal complexes in solution. This is challenging to do at and above the critical point of water (22MPa, 375oC). Fluid inclusions from hydrothermal deposits can be re-heated and used as sample cells for high temperature spectroscopies. Natural Cu and Fe-rich brine / fluid inclusions in quartz from Cu ore deposits from New South Wales, Australia were examined at room temperature and elevated temperatures by XRF mapping and XAFS.
Cu speciation in Hydrothermal Fluid Inclusions Cu 25oC Fe 25oC Cu 495oC Fe 495oC 65mm XRF Mapping Understanding the metal complexes trapped in hydrothermal solutions in minerals is key to understanding the formation of ore deposits. Natural Cu and Fe-rich brine and vapor-phase fluid inclusions in quartz from Cu ore deposits were examined at room temperature and elevated temperatures by XRF mapping and EXAFS. Initial Expectation: chalcopyrite (CuFeS2) would be precipitated out of solution at low temperature, and would dissolve into solution at high temperature. We would study the dissolved solution at temperature. Result:XRF mapping (2mm pixel size) showed that for large vapor-phase inclusions, a uniform distribution of Cu in solution at room temperature was becoming less uniform at temperature. This was reversible, and seen for multiple inclusions.
Cu XANES: Speciation in Fluid Inclusions XANES measurements at low and high temperatures for the vapor-phase inclusions show dramatic differences: Low temp: Cu2+ , aqueous solution High temp: Cu1+ , Cl or S ligand. These results are consistent with Fulton et al [Chem Phys Lett. 330, p300 (2000)] study of Cu solutions near critical conditions: Cu2+ solution at low temperature, and Cu1+ associated with Cl at high temperatures.
Cu XAFS in Fluid Inclusions Cl O 2.35Å 2.09Å Cu2+ Cu1+ O 1.96Å EXAFS from the high temperature phase: Fit (red) to 450C Cu solution XAFS in vapor-phase fluid inclusion (blue). Good fits can be obtained with 1 Cl at ~2.09Å and 1 O at ~2.00Å, or 2 Cl at ~2.08Å. These findings are consistent with the model of for aqueous Cu1+ of Fulton et al. Low temp High temp J. A. Mavrogenes, A. J. Berry, M. Newville, S. R. Sutton, Am. Mineralogist 87, p1360 (2002)
Arsenic/Iron in cattail roots: XRF tomography Nicole Keon, Daniel Brabander, Harold Hemond (MIT), GSECARS The Superfund site at the Wells G+H wetland, Woburn, MA (featured in A Civil Action) contains ~10 tons of arsenic within the upper 50 cm of the sediment. Most of the arsenic is held in the wetland sediments with relatively little As in the groundwater. Usually an iron-reducing, anoxic environment such as a sediment would be expected to have high As mobility. Can the metabolic activity of wetland plants, such as Typha latifolia (cattail) explain the sequestration of arsenic in the wetland? Within ~100mm of the roots, Fe is oxidized to Fe(III) and forms a plaque on the root, even in these sediments. Could As be adsorbed to the ferric oxy-hydroxides formed at the root exteriors? Where is As in the cattail roots? What elements (Fe) are associated with As? What is the As oxidation state in the roots? As Fe Zn Cu Physical slicing the root for 2D XRF mapping would damage the sample. Fluorescence tomography can make a virtual slice of the root and show the elemental associations and concentrations in the slice.
X-ray Fluorescence Tomography: Overview X-ray computed microtomography (CMT) gives 3D images of the x-ray absorption coefficient. An absorption image is collected as the angle w is rotated through 180o, and the 3D image is reconstructed in software. In some cases, element-specific images can be made by tuning the x-ray energy above and below an absorption edge. broad x-ray beam Phosphor Sample visible light CCD camera w rotation stage focused x-ray beam Fluorescence x-ray tomography use a focused beam, scanned across the sample. The sample is rotated around wand translated in x. Fluorescence x-rays are collected as for XRF maps. Transmission x-rays are measured as well to give an overall density tomograph. Sample Transmission detector fluoresced x-rays w fluorescence detector x • can collect multiple fluorescence lines. rotation and translation stages • data collection is relatively slow – • one slice can be made at a time. • can be complicated by self-absorption.
Fluorescence Tomography: Experimental Setup Fluorescence detector: multi-element Ge detector Sample stage: x-y-z-q Sample, mounted on silica fiber, or in ‘shrink-wrap’ tube, on a goniometer head KB mirrors, with Pb tape shield Optical microscope
Fluorescence Tomography: Sinograms The raw fluorescence tomography data consists of elemental fluorescence (uncorrected for self-absorption) as a function of position and angle: a sinogram. This data is reconstructed as a virtual slice through the sample by a coordinate transformation of (x,w) (x, y). The process can be repeated at different z positions to give three-dimensional information. Fluorescence sinograms collected simultaneously for Zn, Fe, and As for a cross-section of As-contaminated cattail root (photo, right): x: 1100mm in 10mm steps w: 180 in 3 steps Zn Fe As w x
Fluorescence Tomogram Slices of Cattail Roots Wells G&H Typha latifolia root: reconstructed slices from fluorescence m-tomography, showing As concentrated on the root exterior, associated with Fe. Quantitative XRF analysis of the As and Fe concentrations from these slices give an Ag/Fe molar ratio of ~10 ppm, consistent with the average from bulk, wet chemical techniques. Though only a few virtual slices could be made, this gives us confidence that the slices made are representative of the average. As Fe • As and Fe are both at root plaque, not in the root interior. As and Fe are ~98% correlated. • Cu, Zn, and Pb (not shown) are less uniform on plaque, suggesting they are not co-precipitated with or sorbed onto the Fe phase. • Bulk XAFS of Fe shows Fe(III). Zn Cu
As XANES XANES measurements on the Typha latifolia cattail roots show mixed As oxidation state – roughly equal portions As3+ and As5+. The As3+ fraction did vary between different root samples, and even along a single root. Is there a spatial dependence to the As oxidation state?
As XANES, Oxidation State Tomograms XANES measurements on the Typha latifolia cattail roots show mixed As oxidation state – roughly equal portions As3+ and As5+. The As3+ fraction did vary between different root samples, and even along a single root. Is there a spatial dependence to the As oxidation state? Fluorescence tomograms made at 2 different energies: EAs total As concentration EAs3+ As3+concentration would show spatial dependence of the As oxidation state.
As oxidation tomograms for Cattail Roots As3+ The As3+ / As ratio is heterogeneous (boxed areas). As5+ appears correlated with metals (Fe, Cu, Zn). As3+ total As total As3+ total As5+ appears at location with high Fe. As5+ appears at location with high Cu and Zn. More detailed spatial and oxidation state information would need faster data collection rates.
Future Directions and Microprobe Improvements The GSECARS microprobe station is running well and productively, combining mXRF, mapping, XANES, and EXAFS for a wide range of problems in geological, soil, and environmental sciences. Areas for Improvement: Beam positional stability, especially during XAFS scans Ease of focus to below 2mm Using new x-ray beam position monitor with fast feedback, our 1-m long beamline KB mirrors can be used to stabilize the beam position at the ~200mm slit in front of the small KB mirrors. Data collection speed / efficiency Even using DXP electronics for the multi-element detector, the detector is the rate limiting step for maps and XAFS. Being able to read out the detector faster will help speed up mapping and XAFS collection.