Download

1 / 8
80 likes | 168 Views
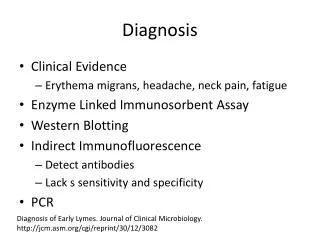
Diagnosis. Roc Curve. ROC Curve. The ROC Curve procedure provides a useful way to evaluate the performance of classification schemes that categorize cases into one of two groups. Sensitivity and Specificity. Sensitivity = P(+|D) ; Specificity = P(-|H). Normal. Disease. -. +.

E N D
Diagnosis Roc Curve
ROC Curve The ROC Curve procedure provides a useful way to evaluate the performance of classification schemes that categorize cases into one of two groups
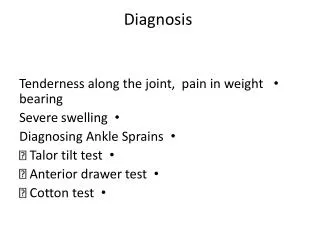
Sensitivity and Specificity Sensitivity = P(+|D) ; Specificity = P(-|H) Normal Disease - + Cut off Point
ROC : Example 1 This is a hypothetical data file that concerns the efforts of a pharmaceutical lab to develop a rapid assay for detecting HIV infection. The results of the 3 assays are 10 deepening shades of red, with deeper shades indicating greater likelihood of infection. A laboratory trial was conducted on 200 blood samples, half of which were infected with HIV, and half of which were clean. (SPSS11)
ROC : Example 2 Fever: A physician is interested in predicting whether or not patients will have the symptom of fever. You have proposed a model that is based on a subset of the two available biochemical predictors, Use ROC Curve to compare the predictive abilities of these two models. (NCSS)
ROC : Example 3 Bank-loan : A bank is interested in predicting whether or not customers will default on loans. You have proposed a model that is based on a subset of the available predictors, and you now need to show that its results are better than those from a simpler model currently in use and no worse than results from a more complex model. Use ROC Curve to compare the predictive abilities of these three models.(SPSS11)