Download
1 / 26
270 likes | 363 Views
Photo (c) Hannu Karttunen. Studies of inverted-spectrum radio sources and candidates. Merja Tornikoski TKK / Metsähovi Radio Observatory, Finland In collaboration with: I. Torniainen, A. Lähteenmäki, T. Hovatta, E. Nieppola, M. Turunen, M. Lainela, E. Valtaoja,

E N D
Photo (c) Hannu Karttunen Studies of inverted-spectrum radio sources and candidates Merja TornikoskiTKK / Metsähovi Radio Observatory, FinlandIn collaboration with:I. Torniainen, A. Lähteenmäki, T. Hovatta, E. Nieppola, M. Turunen, M. Lainela, E. Valtaoja, M.F. Aller, H.D. Aller, M. Mingaliev, S. Trushkin
Why study GPS sources? • ”Ordinary” sources have a falling (steep) or a flat spectrum flux at high frequencies considerablylower or at most equal to that of lower freq. • Sources for high-freq studies are usually selectedbased on their low-freq fluxes. • Sources with inverted spectraare easily excludedand ignored!
Starting point in 2000 • Our earlier studies showed that some sources that were earlier assumed to be faint in the mm-domain could be surprisingly bright. • Lots of interesting (bright) sources had been excluded from high-frequency radio studies.
Starting point in 2000 • Our earlier studies showed that some sources that were earlier assumed to be faint in the mm-domain could be surprisingly bright. • Lots of interesting (bright) sources had been excluded from high-frequency radio studies. • If at least some of them belong to the extreme-peaking GPS class, maybe the number of high-peaked sources is larger than earlier assumed.
Metsähovi and SEST AGN samples • Initially, long term data forca. 200 radio-bright AGNs. • 22, 37, 86 GHz and 90, 230 GHz. • Data streams were 15 - 20+ yrs. • Additional data from the literature. • Multifreq. continuum spectra. • Wanted to • Search for new GPS-type spectra. • Search for extreme-peaked sources. • Confirm existing GPS-classifications.
Results from the first studies • Lots of variability, also for sources classified as GPS sources in the literature! • Some new sources with inverted spectra identified, but most of them also variable.- Tornikoski et al. 2000, AJ120, 2278- Tornikoski et al. 2001, AJ121, 1306
Next step: a closer look at the ”genuine” GPS sources • 1) 60 sources classified as GPS sources or candidates in the literature. • 2) Comparison sample of 96 GPS galaxies. • New observations at Metsähovi, SEST and RATAN-600 + unpublished data from the UMRAO. • 1-230 GHz continuum spectra.
Previously identified as GPS sources... Figs 3-4 in Torniainen et al. 2005, A&A 435, 839
Results from the ”closer look” sample 1) • Torniainen et al. 2005, A&A 435, 839 • No new GPS sources (out of 16 candidates). • Many GPS sources from the literature did not retain their GPS spectrum! (Only 5 out of 44 did). • Also many of those still with a convex spectrum at times were highly variable. The number of genuine GPS sources is much lower than earlier assumed!
... What about GPS galaxies? • 96 galaxies classified as GPS sources in the literature. • Our data sets for this sample were much sparser than for sample 1) • For some of them we only had few-epoch observations difficult / impossible to determine actual spectra.
Sources with too few data points for accurate classification
Results from the ”closer look” sample 2) • Torniainen et al. 2007, A&A 469, 451 • For galaxies, the number of sources retaining their GPS spectra is higher. (29 out of 96). • However, also steep and flat spectra, as well as convex spectra with variability were found. • 30% could not be classified due to too sparse data. • Also for many of the remaining GPS galaxies the data streams were shorter than for sample 1) Indications that the number ofgenuine GPS galaxies is higher thanthat of GPS quasars BUT: also lots of incorrect identifications among these!
How to find out if the source is highly variable? Example:Dense sampling for 3 years Three 3-year sets of data... How much do we really know? A B C
Long term variability • Three (five, ten, ...?) years of observations are not enough for determing a ”typical behaviour” of an AGN! • Long timescales are more important than dense sampling! • At 37 GHz it is much more likely to catch a source in a quiescent/intermediate state than in an active state. • Hovatta et al. A&A 469, 899, 2007 and several other papers submitted & in preparation (Hovatta et al.; Nieppola et al). • Flares are seen on average every 4-6 years. • Flares typically last 2.5 years at 22 & 37 GHz but range between 0.3-13.2 yrs.
What does this mean? • No idea about the ”real” activity behaviour unless monitored for a long time (ca. 15+ yrs) • Incorrect conclusions about variability, continuum spectra, detectability etc. • Misinterpretations about source types & subtypes etc.
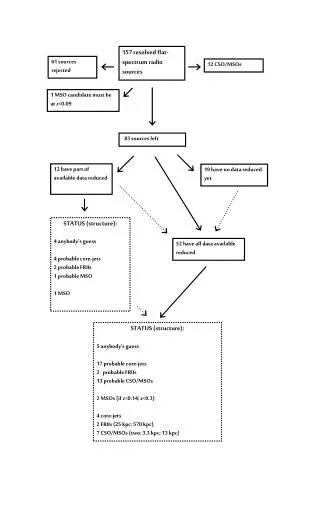
Cluster analysis of GPS sources + candidates with self-organising maps • 206 GPS sources from the literature. • A massive database of source properties. • Cluster analysis using self-organising maps (SOM) = neural networks trained by an unsupervised algorithm. • No a priori assumption about the cluster memberships. • We tested several clustering methods and clustering parameters; no substantial differences. • We traced the locations of different types of sources on the map with an auxiliary classification. Torniainen et al. 2008, A&A 482, 483
Cluster analysis of GPS sources High variability, very bright Genuine GPS sources Incorrect classific, Flat spectra, high pol., highvariability Differenttypes of young sources Possible GPS sources,data too sparse to confirm
Cluster analysis of GPS sources • Confirms the contamination of GPS samples by small, beamed, blazar-type sources. • Also the remaining GPS sources are heterogeneous: various different populations in addition to the quasar/galaxy dualism. • 1) Very young galaxy CSOs with low radio powers and low intrinsic turnover frequencies. • 2) Mixture of CSO and CD qsos and galaxies w. high peak frequencies and high radio powers; probably also young, but differ from the abovementioned population. • 3) Consistent GPS spectra with core-jet morphologies. • 4) Possible free-free –absorbed population.
Conclusions • GPS sources in the literature still include numerous incorrectly identified sources (in reality they are blazars or other variable flat-spectrum sources). • The ”master list” of GPS sources should be revised. • Long term multifrequency monitoring is absolutely essential for correct identifications! • Also the remaining sources with consistent GPS-spectra are heterogeneous and do not form one single population. • Most of them are in accordance with the ”youth scenario”, but also other subpopulations are probable.