Download
1 / 1
20 likes | 131 Views
kbbl. Fuel @ Distributors. kbbl. Fuel @ Distributors. 30,000. 30,000. 20,000. 20,000. 10,000. 10,000. 0. 0. 12. 24. 36. 48. 60. 72. 12. 24. 36. 48. 60. 72. Weeks. Weeks. kbbl. Fuel @ Distributors. 30,000. 20,000. 10,000. 0. 12. 24. 36. 48. 60. 72. Weeks.

E N D
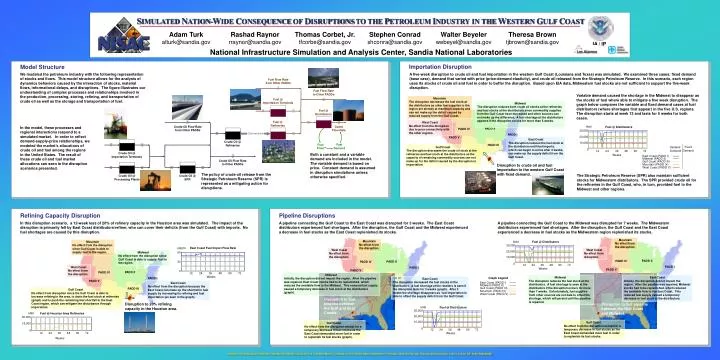
kbbl Fuel @ Distributors kbbl Fuel @ Distributors 30,000 30,000 20,000 20,000 10,000 10,000 0 0 12 24 36 48 60 72 12 24 36 48 60 72 Weeks Weeks kbbl Fuel @ Distributors 30,000 20,000 10,000 0 12 24 36 48 60 72 Weeks Graph Legend East Coast (PADD I) Midwest (PADD II) Gulf Coast (PADD III) Mountain (PADD IV) West Coast (PADD V) East Coast Fuel Import Flow Rate kbbl/hr 60 PADD II PADD II PADD II PADD II PADD IV PADD IV PADD IV PADD IV PADD I PADD I PADD I PADD I 30 PADD V PADD V PADD V PADD V PADD III PADD III PADD III PADD III 0 12 24 36 48 60 72 Weeks kbbl Fuel @ Houston Area Refineries 30,000 15,000 0 12 24 36 48 60 72 Weeks SIMULATEDNATION-WIDECONSEQUENCEOFDISRUPTIONSTO THEPETROLEUMINDUSTRYIN THEWESTERNGULFCOAST Adam Turk alturk@sandia.gov Rashad Raynor rraynor@sandia.gov Thomas Corbet, Jr. tfcorbe@sandia.gov Stephen Conrad shconra@sandia.gov Walter Beyeler webeyel@sandia.gov Theresa Brown tjbrown@sandia.gov IA / IP National Infrastructure Simulation and Analysis Center, Sandia National Laboratories Importation Disruption Model Structure A five-week disruption to crude oil and fuel importation in the western Gulf Coast (Louisiana and Texas) was simulated. We examined three cases: fixed demand (base case), demand that varied with price (price-demand elasticity), and crude oil released from the Strategic Petroleum Reserve. In this scenario, each region uses its stocks of crude oil and fuel in order to buffer the disruption. Based upon EIA data, Midwestern fuel stocks are not sufficient to support the five-week disruption. We modeled the petroleum industry with the following representation of stocks and flows. This model structure allows for the analysis of dynamics behaviors caused by the interaction of stocks, material flows, informational delays, and disruptions. The figure illustrates our understanding of complex processes and relationships involved in the production, processing, storing, refining, and transportation of crude oil as well as the storage and transportation of fuel. Fuel Flow Rate from Other PADDs Fuel Flow Rate to Other PADDs Variable demand caused the shortage in the Midwest to disappear as the stocks of fuel where able to mitigate a five week disruption. The graph below compares the variable and fixed demand cases at fuel distributors (where shortages first appear) in the five U.S. regions. The disruption starts at week 12 and lasts for 5 weeks for both cases. Mountain The disruption decreases the fuel stock at the distributors as other fuel supplies to the region are already at maximum capacity and can not make up the deficit caused by reduced supply from the Gulf Coast. Fuel @ Importation Terminals Midwest The disruption reduces both crude oil stocks at the refineries and fuel stocks at the distributors since commodity supplies from the Gulf Coast have decreased and other sources can not make up the difference. A fuel shortage at the distributors appears if the disruption occurs for more than 5 weeks. Fuel @ Distributors Fuel @ Refineries West Coast No effect from the disruption due to poor connectivity with the other regions. Outlet Flow Rate Crude Oil Flow Rate from Other PADDs In the model, these processes and regional interactions respond to a simulated market. In order to reflect demand-supply-price relationships, we modeled the market’s allocations of crude oil and fuel among the regions in the United States. The result of these crude oil and fuel market allocations can seen in the disruption scenarios presented. Conversion East Coast The disruption reduces the fuel stock at the distributors until fuel imports, which can begin to arrive after 3 weeks, can make up the supply deficit from the Gulf Coast. Crude Oil @ Refineries Fuel Demand Fuel Price Gulf Coast The disruption decreases the crude oil stock at the refineries and fuel stock at the distributors as the capacity of remaining commodity sources can not make up for the deficit caused by the disruption to importation. Fixed Demand Variable Demand Crude Oil @ Importation Terminals Both a constant and a variable demand are included in the model. The variable demand is based on price. Constant demand is assumed in disruption simulations unless otherwise specified. East Coast (PADD I) Midwest (PADD II) Crude Oil Flow Rate to Other PADDs Gulf Coast (PADD III) Disruption to crude oil and fuel importation to the western Gulf Coast with fixed demand. Mountain (PADD IV) West Coast (PADD V) The policy of crude oil release from the Strategic Petroleum Reserve (SPR) is represented as a mitigating action for disruptions. The Strategic Petroleum Reserve (SPR) also maintain sufficient stocks for Midwestern distributors. The SPR provided crude oil for the refineries in the Gulf Coast, who, in turn, provided fuel to the Midwest and other regions. Crude Oil @ Processing Plants Crude Oil @ SPR Refining Capacity Disruption Pipeline Disruptions A pipeline connecting the Gulf Coast to the East Coast was disrupted for 3 weeks. The East Coast distributors experienced fuel shortages. After the disruption, the Gulf Coast and the Midwest experienced a decrease in fuel stocks as the East Coast replenished its stocks. In this disruption scenario, a 12-week loss of 20% of refinery capacity in the Houston area was simulated. The impact of the disruption is primarily felt by East Coast distributors/refiner, who can cover their deficits (from the Gulf Coast) with imports. No fuel shortages are caused by this disruption. A pipeline connecting the Gulf Coast to the Midwest was disrupted for 7 weeks. The Midwestern distributors experienced fuel shortages. After the disruption, the Gulf Coast and the East Coast experienced a decrease in fuel stocks as the Midwestern region replenished its stocks. Mountain No effect from the disruption. Mountain No effect from the disruption. Mountain No effect from the disruption since Gulf Coast is able to supply fuel to the region. West Coast No effect from the disruption. West Coast No effect from disruption. Midwest No effect from the disruption since Gulf Coast is able to supply fuel to the region. West Coast No effect from the disruption. Midwest Initially, the disruption did not impact the region. After the pipeline was repaired, East Coast stocks had to be replenished, which reduced the available flow to the Midwest. This reduced fuel supply caused a temporary decrease in fuel stock at the distributors (graph). Midwest The disruption reduces the fuel stock at the distributors. A fuel shortage is seen at the distributors if the disruption occurs for more than 7 weeks. Unfortunately, fuel supplies from other sources are not bale to offset the shortage, which will persist until the pipeline is repaired. East Coast Initially, the disruption did not impact the region. After the pipeline was repaired, Midwest stocks had to be replenished, which reduced the available flow to the East Coast. This reduced fuel supply caused a temporary decrease in fuel stock at the distributors. East Coast The disruption decreased the fuel stocks at the distributors. A fuel shortage at the retailers is seen if the disruption lasts for 3 weeks (graph). After 3 weeks the shortage disappears as fuel importation is able to offset the supply deficit from the Gulf Coast. East Coast No effect from the disruption because the East Coast can make up the shortfall in fuel supply by increasing its refining and fuel importation (as seen in the graph). Gulf Coast No effect from disruption since the Gulf Coast is able to increase refining in the area, to drain the fuel stock at refineries (graph) and to push the remaining fuel shortfall to the East Coast region, which can mitigate the disturbance through importation. Disruption to fuel pipeline between the Gulf and East Coasts. Disruption to 20% refining capacity in the Houston area. Disruption to fuel pipeline between the Gulf Coast and Midwest. Gulf Coast No effect from the disruption except for a temporary decrease in fuel stocks as the East Coast demanded more fuel in order to replenish its fuel stocks. Gulf Coast No effect from the disruption except for a temporary decrease in fuel stocks as the East Coast demanded more fuel in order to replenish its fuel stocks (graph).