Download
1 / 22
220 likes | 334 Views
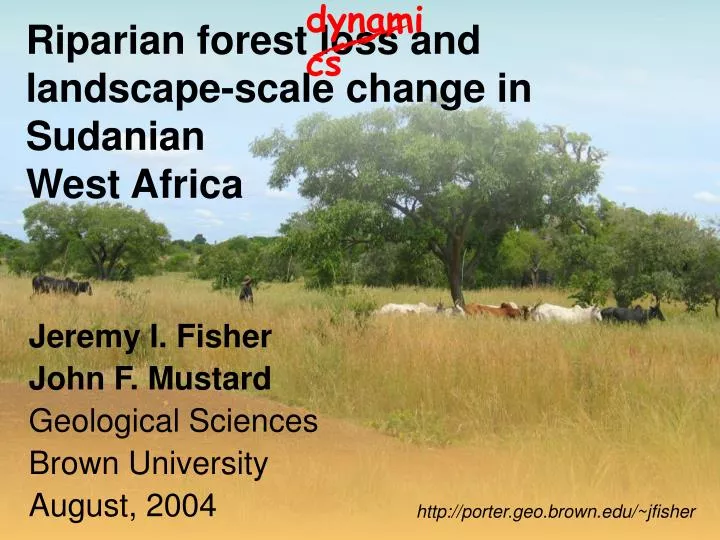
dynamics. Riparian forest loss and landscape-scale change in Sudanian West Africa. Jeremy I. Fisher John F. Mustard Geological Sciences Brown University August, 2004. http://porter.geo.brown.edu/~jfisher. Precipitation in W. Africa controlled by annual movement of ITCZ

E N D
dynamics Riparian forest loss and landscape-scale change in Sudanian West Africa Jeremy I. Fisher John F. Mustard Geological Sciences Brown University August, 2004 http://porter.geo.brown.edu/~jfisher
Precipitation in W. Africa controlled by annual movement of ITCZ zones of increasing dryness to the north occasional catastrophic drought Culture and climate linked: Pastoralists in the north Agriculturalists in the south Sudanian zone forms climate and land-use margin Pastoralists Sheep Goats Cows Agriculturalists Millet Sorghum Maize Groundnuts Sudanian Climate Zone Sudanian West Africa West Africa Precipitation Isohets (mm / yr)
Environmental stress Natural population gain Immigration from Sahel during the droughts of 1968-1973 and 1983-1984 Question: Under intense land use, can we separate the influences of climatic change and anthropogenic change? Control one variable (land use) in a natural experiment Sudanian West Africa Floodplain cleared for agriculture Intense grazing
Burkina Faso North = pastoralists South = agriculturalists Nouhao Valley Abandoned in mid-century due to Onchocerciasis (River blindness) Resettled in 1984 after Onchocerciasis Control Program Experimental division of Pastoralists and Agriculturalists Nouhao Valley Burkina Faso Burkina Faso Departments Agricultural Zone Pastoral Zone Pastoral Zone Agricultural Zone 100 km 10 km Burkina Faso Ghana Nouhao Valley, Burkina Faso
Natural experiment Abandonment and resettlement leave impact on land cover Opportunity to observe spatial patterns of change due to land uses Satellite analysis Two scales of observation High temporal resolution (fast repeat time) High spatial resolution (detailed imagery) Look for patterns of vegetative change Regional patterns = climate induced Local patterns = land cover change Pastoral Zone Agricultural Zone Methods Nouhao Valley Burkina Faso Landsat Real color 2002 Agricultural Zone Pastoral Zone 10 km 10 km Burkina Faso Ghana
AVHRR instrument collects daily global images of NDVI 1981 to 2000 8 km resolution NDVI ~ photosynthetic greenness Sum of all NDVI in a growing season is proportional to NPP NPP tracks rainfall closely, slope of NPP indicates Changing climatic conditions Changing species compositions NDVI area " NPP NPP Cumulative Rainfall (mm) Total Rainfall NPP (Mg C ha-1 y-1) Year Satellite proxy for NPP Peak of growing season Average Rainfall in Nimay, Niger NDVI Avg. NDVI Avg. Rainfall (mm) NDVI (photosynthetic greenness) Rainfall Dry season Date NDVI
Slope of NPP indicates: Regionally increasing vegetation 1980 to 2000 tracks increasing rainfall Recovery from drought Nouhao Valley has pronounced vegetation increase NPP Cumulative Rainfall (mm) Total Rainfall NPP (Mg C ha-1 y-1) Year g C m-2 y-2 -20 20 Net Primary Productivity Slopes Slope of Net Primary Productivity from AVHRR 1980 – 2000 Nouhao Valley Pastoral Zone Agricultural Zone Towns
Landsat Thematic Mapper 30 meter resolution Scenes acquired in transition season (October) Grasses senesced Trees leaf-on Spectral unmixing Determine % ground cover Soil Non-photosynthetic vegetation Green vegetation = shrub and tree abundance Multi-temporal analysis Analyze trajectories of shrub and tree % cover through time 1984, 1989, 1999, 2001, 2002 Cumulative Rainfall (mm) NPP (Mg C ha-1 y-1) Year Landsat Drivers of Land Cover Percent cover of trees and shrubs Y = 0.97X - 0.19 R2=0.366 Spectral unmixing model Ground transects
Vegetation fractional abundance from Landsat October 20th 2002 Display inset 1.0 Pastoral Zone 0.0 Agricultural Zone Fractional Abundance 1984 1989 1999 2001 2002 Real Color Image Landsat Bands 321 (RGB) October 20th 2002
Agricultural Zone Pastoral Zone 1984
Agricultural Zone Pastoral Zone 1984
Agricultural Zone Pastoral Zone 1986
Agricultural Zone Pastoral Zone 1988
Agricultural Zone Pastoral Zone 1990
Agricultural Zone Pastoral Zone 1992
Agricultural Zone Pastoral Zone 1994
Agricultural Zone Pastoral Zone 1996
Agricultural Zone Pastoral Zone 1998
Agricultural Zone Pastoral Zone 2000
Agricultural Zone Pastoral Zone 2002
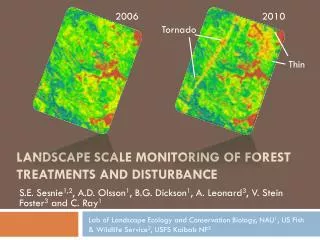
Afforestation or Deforestation Year Deforested Afforested gain Non-Riparian areas No change or little veg Riparian areas loss • Slope of vegetation gain multiplied by vegetation abundance in 1993 • Note • general increase in vegetation abundance • pronounced gain in pastoral riparian zone • dramatic loss in agricultural riparian zone. Forest Gallery Loss or Gain from 1984 to 2002 Agricultural Zone Pastoral Zone
~ 10% increase over 2 decades due to increased wetness Agricultural area cleared in 1980s, thus relative loss of trees and shrubs Agricultural riparian area decrease Firewood use Loss of margins through repeated fire Pastoral riparian area increase Shrubs and trees favored by No Fire Bovine herbivory Increased nutrient load from bovines Signal is strong and consistent Satellite multi-platform and multi-temporal analysis is an effective means of segregating climatic and anthropogenic land cover influences Non-riparian Riparian Percentage shrub and tree cover change over 20 years Land use zone ConclusionsPatterns and Drivers http://porter.geo.brown.edu/~jfisher Manuscript available