Download
1 / 1
10 likes | 204 Views
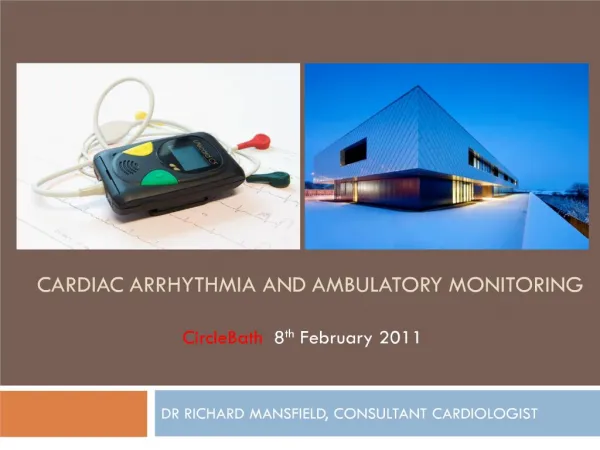
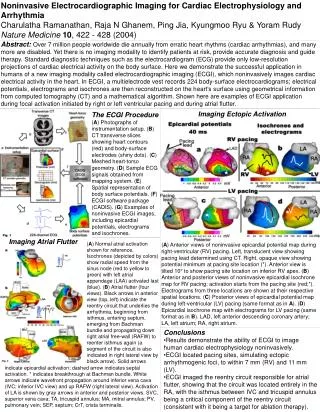
Noninvasive Electrocardiographic Imaging for Cardiac Electrophysiology and Arrhythmia Charulatha Ramanathan, Raja N Ghanem, Ping Jia, Kyungmoo Ryu & Yoram Rudy Nature Medicine 10 , 422 - 428 (2004) .

E N D
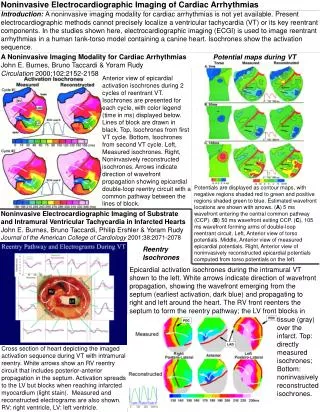
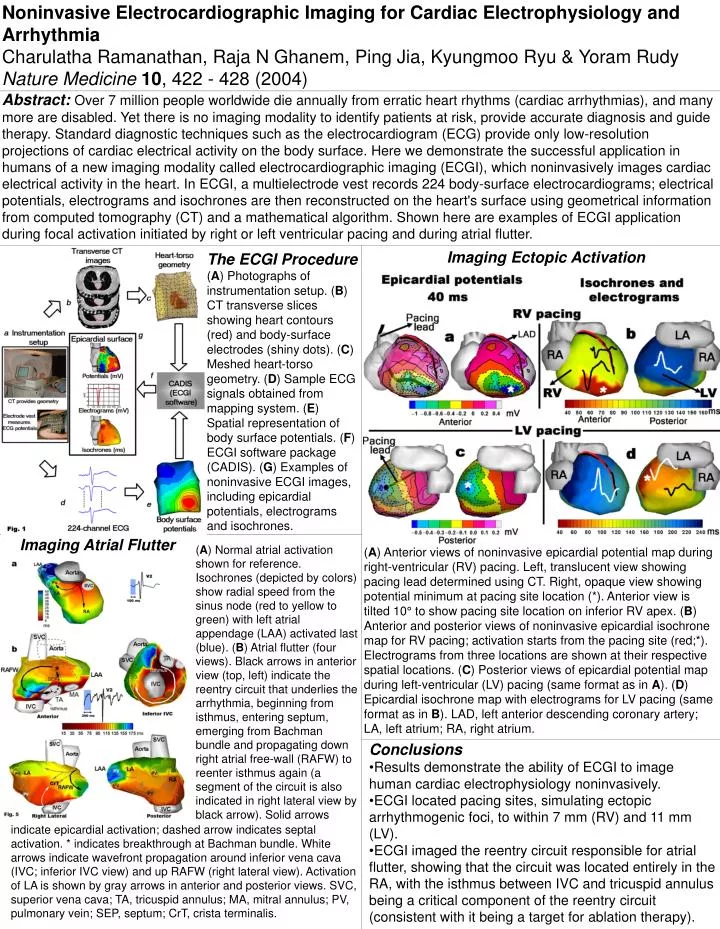
Noninvasive Electrocardiographic Imaging for Cardiac Electrophysiology and Arrhythmia Charulatha Ramanathan, Raja N Ghanem, Ping Jia, Kyungmoo Ryu & Yoram Rudy Nature Medicine10, 422 - 428 (2004) Abstract: Over 7 million people worldwide die annually from erratic heart rhythms (cardiac arrhythmias), and many more are disabled. Yet there is no imaging modality to identify patients at risk, provide accurate diagnosis and guide therapy. Standard diagnostic techniques such as the electrocardiogram (ECG) provide only low-resolution projections of cardiac electrical activity on the body surface. Here we demonstrate the successful application in humans of a new imaging modality called electrocardiographic imaging (ECGI), which noninvasively images cardiac electrical activity in the heart. In ECGI, a multielectrode vest records 224 body-surface electrocardiograms; electrical potentials, electrograms and isochrones are then reconstructed on the heart's surface using geometrical information from computed tomography (CT) and a mathematical algorithm. Shown here are examples of ECGI application during focal activation initiated by right or left ventricular pacing and during atrial flutter. Imaging Ectopic Activation The ECGI Procedure (A) Photographs of instrumentation setup. (B) CT transverse slices showing heart contours (red) and body-surface electrodes (shiny dots). (C) Meshed heart-torso geometry. (D) Sample ECG signals obtained from mapping system. (E) Spatial representation of body surface potentials. (F) ECGI software package (CADIS). (G) Examples of noninvasive ECGI images, including epicardial potentials, electrograms and isochrones. Imaging Atrial Flutter (A) Normal atrial activation shown for reference. Isochrones (depicted by colors) show radial speed from the sinus node (red to yellow to green) with left atrial appendage (LAA) activated last (blue). (B) Atrial flutter (four views). Black arrows in anterior view (top, left) indicate the reentry circuit that underlies the arrhythmia, beginning from isthmus, entering septum, emerging from Bachman bundle and propagating down right atrial free-wall (RAFW) to reenter isthmus again (a segment of the circuit is also indicated in right lateral view by black arrow). Solid arrows (A) Anterior views of noninvasive epicardial potential map during right-ventricular (RV) pacing. Left, translucent view showing pacing lead determined using CT. Right, opaque view showing potential minimum at pacing site location (*). Anterior view is tilted 10° to show pacing site location on inferior RV apex. (B) Anterior and posterior views of noninvasive epicardial isochrone map for RV pacing; activation starts from the pacing site (red;*). Electrograms from three locations are shown at their respective spatial locations. (C) Posterior views of epicardial potential map during left-ventricular (LV) pacing (same format as in A). (D) Epicardial isochrone map with electrograms for LV pacing (same format as in B). LAD, left anterior descending coronary artery; LA, left atrium; RA, right atrium. • Conclusions • Results demonstrate the ability of ECGI to image human cardiac electrophysiology noninvasively. • ECGI located pacing sites, simulating ectopic arrhythmogenic foci, to within 7 mm (RV) and 11 mm (LV). • ECGI imaged the reentry circuit responsible for atrial flutter, showing that the circuit was located entirely in the RA, with the isthmus between IVC and tricuspid annulus being a critical component of the reentry circuit (consistent with it being a target for ablation therapy). indicate epicardial activation; dashed arrow indicates septal activation. * indicates breakthrough at Bachman bundle. White arrows indicate wavefront propagation around inferior vena cava (IVC; inferior IVC view) and up RAFW (right lateral view). Activation of LA is shown by gray arrows in anterior and posterior views. SVC, superior vena cava; TA, tricuspid annulus; MA, mitral annulus; PV, pulmonary vein; SEP, septum; CrT, crista terminalis.