Download
1 / 1
10 likes | 151 Views
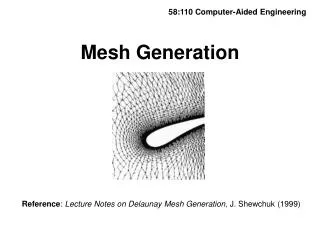
Fixed Sub-domain. Dynamic Stall in Vertical Axis Wind Turbines. Dynamic Sub-domain. Fixed Sub-domain.

E N D
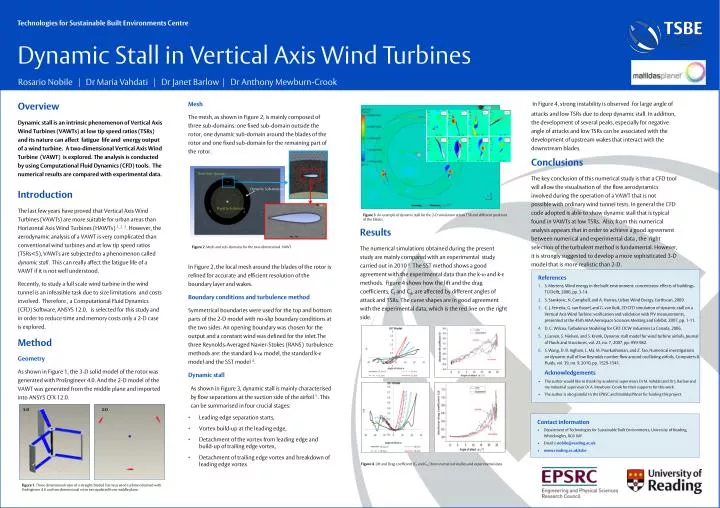
Fixed Sub-domain Dynamic Stall in Vertical Axis Wind Turbines Dynamic Sub-domain Fixed Sub-domain In Figure 4, strong instability is observed for large angle of attacks and low TSRs due to deep dynamic stall. In addition, the development of several peaks, especially for negative angle of attacks and low TSRs can be associated with the development of upstream wakes that interact with the downstream blades. Overview Dynamic stall is an intrinsic phenomenon of Vertical Axis Wind Turbines (VAWTs) at low tip speed ratios (TSRs) and its nature can affect fatigue life and energy output of a wind turbine. A two-dimensional Vertical Axis Wind Turbine (VAWT) is explored. The analysis is conducted by using Computational Fluid Dynamics (CFD) tools. The numerical results are compared with experimental data. Introduction The last few years have proved that Vertical Axis Wind Turbines (VAWTs) are more suitable for urban areas than Horizontal Axis Wind Turbines (HAWTs) 1, 2, 3. However, the aerodynamic analysis of a VAWT is very complicated than conventional wind turbinesand at low tip speed ratios (TSRs<5), VAWTs are subjected to a phenomenon called dynamic stall. This can really affect the fatigue life of a VAWT if it is not well understood. Recently, to study a full scale wind turbine in the wind tunnel is an infeasible task due to size limitations and costs involved. Therefore , a Computational Fluid Dynamics (CFD) Software, ANSYS 12.0, is selected for this study and in order to reduce time and memory costs only a 2-D case is explored. Method Geometry As shown in Figure 1, the 3-D solid model of the rotor was generated with ProEngineer 4.0. And the 2-D model of the VAWT was generated from the middle plane and imported into ANSYS CFX 12.0. Mesh The mesh, as shown in Figure 2, is mainly composed of three sub-domains: one fixed sub-domain outside the rotor, one dynamic sub-domain around the blades of the rotor and one fixed sub-domain for the remaining part of the rotor. In Figure 2, the local mesh around the blades of the rotor is refined for accurate and efficient resolution of the boundary layer and wakes. Boundary conditions and turbulence method Symmetrical boundaries were used for the top and bottom parts of the 2-D model with no-slip boundary conditions at the two sides. An opening boundary was chosen for the output and a constant wind was defined for the inlet.The three Reynolds-Averaged Navier-Stokes (RANS) turbulence methods are: the standard k-ω model, the standard k-ε model and the SST model 4. Dynamic stall As shown in Figure 3, dynamic stall is mainly characterised by flow separations at the suction side of the airfoil 5. This can be summarised in four crucial stages: • Leading edge separation starts, • Vortex build-up at the leading edge, • Detachment of the vortex from leading edge and build-up of trailing edge vortex, • Detachment of trailing edge vortex and breakdown of leading edge vortex • Conclusions • The key conclusion of this numerical study is that a CFD tool will allow the visualisation of the flow aerodynamics involved during the operation ofa VAWT that is not possible with ordinary wind tunnel tests. In general the CFD code adopted is able to show dynamic stall that is typical found in VAWTs at low TSRs. Also, from this numerical analysis appears that in order to achieve a good agreement between numerical and experimental data , the right selection of the turbulent method is fundamental. However, it is strongly suggested to develop a more sophisticated 3-D model that is more realistic than 2-D. Figure 3. An example of dynamic stall for the 2-D simulation at low TSR and different positions of the blades. • Results • The numerical simulations obtained during the present study are mainly compared with an experimental study carried out in 20106. The SST method shows a good agreement with the experimental data than the k- and k-ε methods. Figure 4 shows how the lift and the drag coefficients, Cl and Cd, are affected by different angles of attack and TSRs. The curve shapes are in good agreement with the experimental data, which is the red line on the right side. Figure 2. Mesh and sub-domains for the two-dimensional .VAWT • References • S. Mertens, Wind energy in the built environment: concentrator effects of buildings. TU Delft, 2006, pp. 3-14. • S. Stankovic, N. Campbell, and A. Harries, Urban Wind Energy. Earthscan, 2009 • C. J. Ferreira, G. van Bussel, and G. van Kuik, 2D CFD simulation of dynamic stall on a Vertical Axis Wind Turbine: verification and validation with PIV measurements, presented at the 45th AIAA Aerospace Sciences Meeting and Exhibit, 2007, pp. 1-11. • D. C. Wilcox, Turbulence Modeling for CFD. DCW industries La Canada, 2006. • J. Larsen, S. Nielsen, and S. Krenk, Dynamic stall model for wind turbine airfoils, Journal of Fluids and Structures, vol. 23, no. 7, 2007, pp. 959-982. • S. Wang, D. B. Ingham, L. Ma, M. Pourkashanian, and Z. Tao, Numerical investigations on dynamic stall of low Reynolds number flow around oscillating airfoils, Computers & Fluids, vol. 39, no. 9, 2010, pp. 1529-1541. • Acknowledgements • The author would like to thank my academic supervisors Dr M. Vahdati and Dr J. Barlow and my industrial supervisor Dr A. Mewburn-Crook for their supports for this work. • The author is also grateful to the EPRSC and MatildasPlanet for funding this project. 3-D 2-D • Contact information • Department of Technologies for Sustainable Built Environments, University of Reading, Whiteknights, RG6 6AF • Email: r.nobile@reading.ac.uk • www.reading.ac.uk/tsbe Figure 4. Lift and Drag coefficient (Cl and CD ) from numerical studies and experimental data. Figure 1. Three dimensional rotor of a straight-bladed Darrieus wind turbine obtained with ProEngineer 4.0 and two dimensional rotor extrapolated from middle plane.