Download
1 / 27
270 likes | 277 Views
Chapter 17: Basic principles of intersection signalization (objectives). Chapter objectives: By the end of this chapter the student will be able to:. Explain the meanings of the terms related to signalized intersections

E N D
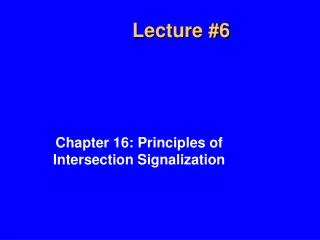
Chapter 17: Basic principles of intersection signalization (objectives) Chapter objectives: By the end of this chapter the student will be able to: • Explain the meanings of the terms related to signalized intersections • Explain the relationship among discharge headway, saturation flow, lost times, and capacity • Explain the “critical lane” and “time budget” concepts • Model left-turn vehicles in signal timing • State the definitions of various delays taking place at signalized intersections • Graph the relation between delay, waiting time, and queue length • Explain three delay scenarios (uniform, random, oversaturated) • Explain the components of Webster’s delay model and use it to estimate delay • Explain the concept behind the modeling of overflow delay • Know inconsistencies that exist between stochastic and overflow delay models Chapter 17
Four critical aspects of signalized intersection operation discussed in this chapter • Discharge headways, saturation flow rates, and lost times • Allocation of time and the critical lane concept • The concept of left-turn equivalency • Delay as a measure of service quality Chapter 17
17.1 Terms and Definitions Cycle length Phase Interval Change interval All-read interval (clearance interval) Controller Chapter 17
Signal timing with a pedestrian signal: Example Cycle length = 55 seconds Chapter 17
17.1.2 Signal operation modes and left-turn treatments & 17.1.3 Left-turn treatments • Operation modes: • Pretimed (fixed) operation • Semi-actuated operation • Full-actuated operation • Computer control • Left-turn treatments: • Permitted left turns • Protected left turns • Protected/permitted (compound) or permitted/protected left turns Chapter 17
Factors affecting the permitted LT movement • LT flow rate • Opposing flow rate • Number of opposing lanes • Whether LTs flow from an exclusive LT lane or from a shared lane • Details of the signal timing Chapter 17
CFI (Continuous Flow Intersection Chapter 17
DDI (Diverging Diamond Interchange) Chapter 17
Four basic mechanisms for building an analytic model or description of a signalized intersection • Discharge headways at a signalized intersection • The “critical lane” and “time budget” concepts • The effects of LT vehicles • Delay and other MOEs (like queue size and the number of stops) Chapter 17
17.2 Discharge headways, saturation flow, lost times, and capacity Δ(i) Start-up lost time Effective green h 1 2 3 4 5 6 7 Vehicles in queue Saturation flow rate Capacity (Show a simulation example) Cycle length Chapter 17
17.3 The “critical lane” and “time budget” concepts Each phase has one and only one critical lane (volume). If you have a 2-phase signal, then you have two critical lanes. 345 Total loss in one hour Total effective green in one hour 100 75 Max. sum of critical lane volumes; this is the total volume that the intersection can handle. 450 N = No. of phases, tL = Lost time, C = Cycle length, h = saturation headway Chapter 17
17.3.2 Finding an Appropriate Cycle Length Desirable cycle length, incorporating PHF and the desired level of v/c Eq. 7-13 Eq. 7-14 Doesn’t this look like the Webster model? The benefit of longer cycle length tapers around 90 to 100 seconds. This is one reason why shorter cycle lengths are better. N = # of phases. Larger N, more lost time, lower Vc. (Review the sample problem on page 482.) Chapter 17
Webster’s optimal cycle length model C0 = optimal cycle length for minimum delay, sec L = Total lost time per cycle, sec Sum (v/s)i = Sum of v/s ratios for critical lanes Delay is not so sensitive for a certain range of cycle length This is the reason why we can round up the cycle length to, say, a multiple of 5 seconds. Chapter 17
17.3.2 Desirable cycle length vs. sum of critical lane volumes (example) Desirable cycle length, Cdes Marginal gain in Vc decreases as the cycle length increases. Cycle length 100% increase Vc 8% increase (Review the sample problem on page 482) Chapter 17
17.4 The effect of left-turning vehicles and the concept of “through car equivalence” In the same amount of time, the left lane discharges 5 through vehicles and 2 left-turning vehicles, while the right lane discharges 11 through vehicles. Chapter 17
Left-turn vehicles are affected by opposing vehicles and number of opposing lanes. 5 1000 1500 1900 The LT equivalent increases as the opposing flow increases. For any given opposing flow, however, the equivalent decreases as the number of opposing lanes is increased. Chapter 17
Left-turn consideration: 2 methods • Given conditions: • 2-lane approach • Permitted LT • 10% LT, TVE=5 • h = 2 sec for through Solution 1: Each LT consumes 5 times more effective green time. Solution 2: Calibrate a factor that would multiply the saturation flow rate for through vehicles to produce the actual saturation flow rate. Chapter 17
17.5 Delay as an MOE Stopped time delay:The time a vehicle is stopped while waiting to pass through the intersection Approach delay: Includes stopped time, time lost for acceleration and deceleration from/to a stop Travel time delay: the difference between the driver’s desired total time to traverse the intersection and the actual time required to traverse it. Time-in-queue delay: the total time from a vehicle joining an intersection queue to its discharge across the stop-line or curb-line. Control delay: time-in-queue delay + acceleration/deceleration delay) • Common MOEs: • Delay • Queuing • No. of stops (or percent stops) Chapter 17
17.5.2 Basic theoretical models of delay Uniform arrival rate assumed, v Here we assume queued vehicles are completely released during the green. Note that W(i) is approach delay in this model. At saturation flow rate, s The area of the triangle is the aggregate delay. Figure 17.10 Chapter 17
Three delay scenarios This is acceptable. This is great. UD = uniform delay OD = overflow delay due to prolonged demand > supply (Overall v/c > 1.0) OD = overflow delay due to randomness (“random delay”). Overall v/c < 1.0 A(t) = arrival function D(t) = discharge function You have to do something for this signal. Chapter 17
Arrival patterns compared Isolated intersections Signalized arterials HCM uses the Arrival Type factor to adjust the delay computed as an isolated intersection to reflect the platoon effect on delay. Chapter 17
Webster’s uniform delay model UDa Total approach delay The area of the triangle is the aggregated delay, “Uniform Delay (UD)”. To get average approach delay/vehicle, divide this by vC Chapter 17
Modeling for random delay UD = uniform delay Analytical model for random delay Adjustment term for overestimation (between 5% and 15%) OD = overflow delay due to randomness (in reality “random delay”). Overall v/c < 1.0 D = 0.90[UD + RD] Chapter 17
Modeling overflow delay because c = s (g/C), divide both sides by v and you get (g/C)(v/c) = (v/s). And v/c = 1.0. The aggregate overflow delay is: Since the total vehicle discharged during T is cT, See the right column of p.493 for the characteristics of this model. Chapter 17
17.5.3 Inconsistencies in random and overflow delay The stochastic model’s overflow delay is asymptotic to v/c = 1.0 and the overflow model’s delay is 0 at v/c =0. The real overflow delay is somewhere between these two models. Chapter 17
Comparison of various overflow delay model 17.5.4 Delay model in the HCM 2000 See Equation 17-27 and its similarities with the Akcelik’s model (eq. 17-26). These models try to address delays for 0.85<v/c<1.15 cases. Chapter 17
17.5.5 Sample delay computations We will walk through sample problems (pages 495-496). Start reading Synchro 6.0 User Manual and SimTraffic 6.0 User Manual. We will use these software programs starting Wednesday, October 21, 2009. Chapter 17