Download

1 / 28
290 likes | 499 Views
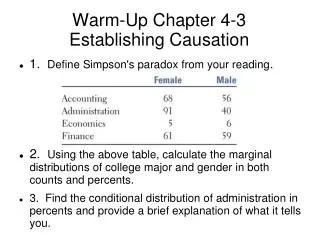
Chapter 4 Section 3 Establishing Causation. AP Statistics Hamilton HW: 4.41 – 4.48. Causation. So does sleeping make whiskers grow?. Establishing Causation.

E N D
Chapter 4 Section 3Establishing Causation AP Statistics Hamilton HW: 4.41 – 4.48
Causation • So does sleeping make whiskers grow?
Establishing Causation • When studying the relationship between two variables, we often hope to show that changes in the explanatory variable cause changes in the response variable. • A strong association between two variables is not enough to draw conclusions about cause and effect. • What ties between two variables (and others lurking in the background) can explain an observed association? • What constitutes good evidence for causation? • We begin our consideration of these questions with a set of examples.
Six Interesting Relationships • These are six examples of observed associations between x and y. • x =mother’s BMI y = daughter’s BMI • x = amount of saccharin in a rat’s diet y = count of tumors in the rat’s bladder • x = a high school senior’s SAT score y = the student’s first-year college GPA • x = monthly flow of money into stock mutual funds y = monthly rate of return for the stock market • x = whether a person regularly attends religious services y = how long the person lives • x = the number of years of education a worker has y = the worker’s income
Explaining Association: Causation • Causation is a direct cause-and-effect link between the variables. • In the figures on the slides in this presentation: • A dashed line represents an observed association between the variables x and y. • A solid blue line represents a causal relationship.
Causation • This is causation. • You can see that changes in x cause changes in y.
BMI in Mothers and Daughters • A study of Mexican-American girls aged 9 to 12 years recorded BMI, a measure of weight relative to height, for both the girls and their mothers. The study also measured hours of TV, minutes of physical activity, and intake of several kinds of food. • The strongest correlation was between the BMI of daughters and their mothers. • Body type is in part determined by heredity. Daughters inherit half their genes from their mothers. As a result, there is a direct causal link between BMI of mothers and daughters. The mothers’ BMI only explain 25.6% (r2) of the variation among the daughter’s BMI. Other factors, such as diet and exercise, also influence BMI. • Note: Even when direct causation is present, it is rarely a complete explanation of an association between two variables.
Saccharin in Rats • The best evidence for causation actually comes from experiments that actually change x while holding all other factors fixed. If y changes, we have good reason to think that x caused the change in y. • Experiments have shown conclusively that large amounts of saccharin in the diet cause bladder tumors in rats. Should we avoid saccharin as a replacement for sugar in food? • Rats are not people. Although we cannot experiment with people, studies of people who consume different amounts of saccharin show little association between saccharin and bladder tumors. • Note: Even well-established causal relations may not generalize to other settings.
Explaining Association: Common Response • Beware the lurking variable is good advice when thinking about an association between two variables. • In common response, the observed association between two variables x and y is explained by a lurking variable z. • In this instance, both x and y change in response to changes in z. • This common response creates an association even though there may be no direct causal link between x and y.
Common Response • This is a common response. • We can see from the diagram that changes in both x and y are caused by a third lurking variable z. • Can you think of an example? • Families that eat together have children that are more well-balanced. Is there some other variable influencing both of these?
SAT and GPA • Students who are smart and who have learned a lot tend to have both high SAT scores and high college grades. The positive correlation is explained by this common response to students’ ability and knowledge.
Mutual Funds and the Stock Market • There is a strong positive correlation between how much money individuals add to mutual funds each month and how well the stock market does the same month. Is the new money driving the market up? The correlation may be explained in part by common response to underlying investor sentiment: when optimism reigns, individuals send money to funds and large institutions also invest more. The institutions would drive up prices even if individuals did nothing. • It is also worth noting that what causation there is may actually operate in the other direction. When the market is doing well, individuals rush to add money to their mutual funds.
Explaining Causation: Confounding • We noted in the association of BMI of daughters and mothers that inheritance explained part of the causation. • It is possible that mothers who are overweight also set an example of little exercise, poor eating habits, and lots of TV. As a result, their daughters pick up these habits to some extent, so the influence of heredity is mixed up with influences from the girls’ environment. • It is this mixing of influences that we call confounding.
Explaining Causation: Confounding • Confounding often prevents us from drawing conclusions about causation. • In confounding, both the explanatory variable x and the lurking variable z may influence the response variable y. • Because x is confounded with z, we cannot distinguish the influence of x from the influence of z. • We cannot say how strong the direct effect of x is on y. In fact, it can be hard to say if x influences y at all.
Confounding • This is confounding. • Confounding occurs when the effect of x on y is unclear because of the effect of a lurking variable z. • Can you think of an example? • Hamilton’s students all do well on state testing? Is there an association or is it confounded?
Religion and Life Span • Many studies have found that people who are active in their religion live longer than nonreligious people. But people who attend church or mosque or synagogue also take better care of themselves than nonattenders. They are less likely to smoke, more likely to exercise, and less likely to be overweight. The effects of these good habits are confounded with the direct effects of attending religious services.
Education and Income • It is likely that more education is cause of higher income – many highly paid professions require advanced education. However, confounding is also present. People who have high ability and come from prosperous homes are more likely to get many years of education than people who are less able or poorer. Of course, people who start out able and rich are more likely to have high earnings even without much education. We can’t say how much of the higher income of well-educated people is actually caused by their education.
Warnings • Many observed associations are at least partly explained by lurking variables. Both common response and confounding involve the influence of a lurking variable (or variables) z on the response variable y. The distinction between these two types of relationships is less important than the common element – the influence of lurking variables. • The most important lesson of these examples is one we have already emphasized: even a very strong association between two variables is not by itself good evidence that there is a cause-and-effect link between the variables.
Establishing Causation • How can a direct causal link between x and y be established? • The best method of establishing causation is to conduct a carefully designed experiment in which the effects of possible lurking variables are controlled. (This is why we use randomness.) • Many of the sharpest disputes in which statistics plays a role involve questions of causation that cannot be settled by experiment. • Some of these questions are listed on the next slide.
Establishing Causation • Does gun control reduce violent crime? • Does living near power lines cause cancer? • Has increased free trade helped to increase the gap between the incomes of more educated and less educated American workers? • All of these questions have become public issues. All concern associations among variables. • All also have this in common: they try to pinpoint cause and effect in a setting involving complex relations among many variables. Common response and confounding, along with the number of potential lurking variables, make observed associations misleading. In these settings, experiments are not possible for ethical or practical reasons. So we must rely on observational studies, which have limitations.
Power Lines and Leukemia • Do power lines increase the risk of leukemia? • Laboratory studies have shown that really strong magnetic fields can disturb living cells. What about the effect of weaker magnetic fields we experience if we live near power lines? • It isn’t ethical to do experiments that expose children to magnetic fields. It is also hard to compare children who live in more and less exposed areas because of how rare leukemia is and how different each location is besides the magnetic fields. • As a result, we must rely on studies that compare children with leukemia with children who don’t.
Power Lines and Leukemia • A careful study in which the researchers compared 638 children with leukemia and 620 children without leukemia, found that there was no evidence of more than a chance connection between magnetic fields and childhood leukemia. • “No evidence” that magnetic fields are connected with childhood leukemia doesn’t prove that there is no risk. It says only that a careful study should not find any risk that stands out from the play of chance that distributes leukemia cases across the landscape.
Smoking and Lung Cancer • Despite the difficulty, it is sometimes possible to build a case for causation in the absence of experiments. The evidence that smoking causes lung cancer is about as strong as nonexperimental evidence can be. • Doctors had long observed that must lung cancer patients were smokers. Comparison of smokers and similar nonsmokers showed a very strong association between smoking and death from lung cancer. • Could the association be due to common response? Might there be a genetic factor that predisposes people to both nicotine addiction and to lung cancer? If so, smoking and lung cancer would be positively associated even if smoking had no direct effect on the lungs.
Smoking and Lung Cancer • Or perhaps confounding is to blame. It might be that smokers live unhealthy lives in other ways (diet, alcohol, lack of exercise) and that some other habit confounded with smoking is a cause of lung cancer. • How were these objections overcome?
Criteria for Establishing Causation without an Experiment • The association is strong. – The association between smoking and lung cancer is very strong. • The association is consistent. – Many studies of different kinds of people in many countries link smoking to lung cancer. That reduces the chance of a lurking variable specific to one group or one study explaining the association. • Larger values of the explanatory variable are associated with stronger responses. – People who smoke more cigarettes per day or who smoke over a longer period get lung cancer more often. People who stop smoking reduce their risk.
Criteria for Establishing Causation without an Experiment • The alleged cause precedes the effect in time. – Lung cancer develops after years of smoking. The number of men dying of lung cancer rose as smoking became more common, with a lag of about 30 years. Lung cancer kills more men than any other form of cancer. Lung cancer was rare among women until women began to smoke. Lung cancer is women rose along with smoking, again with a lag of about 30 years, and has now passed breast cancer as the leading cause of cancer death among women. • The alleged cause is plausible. – Experiments with animals show that tars from cigarette smoke do cause cancer.
Criteria for Establishing Causation without an Experiment • Medical authorities do not hesitate to say that smoking causes lung cancer. • The U.S. Surgeon General states that cigarette smoking is “the largest avoidable cause of death and disability in the U.S.” • The evidence for causation is overwhelming – but it is not as strong as the evidence provided by a well-designed experiment. • Conducting an experiment in which some subjects were forced to smoke and others were not allowed to would be unethical. In cases like this, observational studies are our best source of reliable information.