Download
1 / 18
180 likes | 268 Views
An evidence-based overview of indicators for return-to-work John Walsh. The role of KPIs in the continuous improvement cycle. KPIs are the evidence base to inform the continuous improvement cycle. A role for efficient risk profiling in the continuous improvement cycle?.

E N D
An evidence-based overview of indicators for return-to-workJohn Walsh
The role of KPIs in the continuous improvement cycle KPIs are the evidence base to inform the continuous improvement cycle
A role for efficient risk profiling in the continuous improvement cycle?
Example of what is possible – predictive modeling of outcome for workers compensation
What have we learned from this? • Statistical estimation is far more predictive than (even educated) gut feel !! • Predictability improves as the claim develops (eg payment history) • However much variance is still unexplained • “Known” predictors of claim outcome are often either: • poor predictors, eg injury severity, bodily location • or probably spurious, eg occupation, culture “Better” predictors are likely to be soft data, currently not collected
Several key questions underpin the development of a framework of predictive indicators Main Question: What are the next steps to develop and utilise these indicators? • What are the current issues and factors to consider when determining RTW indicators? • How should RTW be defined and measured? • What are the modifiable impediments influencing RTW? • How can we measure return to work and associated modifiable factors?
The universe of possible influencing factors is very large, but not all of them are modifiable
Interrelationship between dimensions: they are part of an intersecting ‘whole’ Modifiable dimensions and Durable RTW
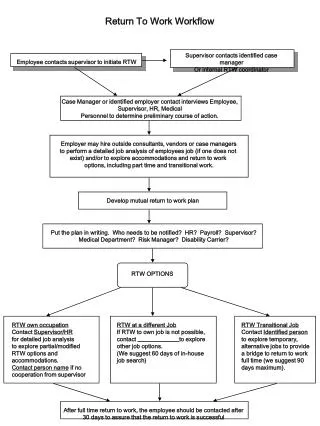
The life cycle of claim reflects both positive and negative influences – sometimes we call these interventions!
From the evidence, we should be measuring very different dimensions to those currently measured • Routine data currently collected: • Mostly include demographics, injury characteristics, workplace characteristics and claim characteristics • Key Dimensions which should be measured if we are to understand and influence the life cycle of a claim: • First return to work • Durable return to work • Capacity to RTW • Health and psychological functioning • Willingness to RTW • Perception of employer attitudes to RTW • Relationships between key stakeholders
Using the evidence base if it existed:Scheme objectives - inputs – impacts and outcomes could/ must be systematically linked RTW Inputs/ Interventions (out of scope) Capacity to RTW Example: Policy First RTW Health & psychological functioning Example: Case management Durable RTW Willingness to RTW Example: Employer interventions Employer attitudes to RTW Example: Insurer interventions Management of the relationships between key stakeholders WorkCover RTW objective RTW outcomes RTW Impacts A timely, safe and durable return to work for injured workers
Approach 1 – Extending and improving current data collection systems • Immediate improvements in existing routine/ administrative data collections could be achieved, to test and demonstrate the gains in terms of better predictive modelling (eg risk profiling, statistical case estimation) • Eg Claims and Policy data bases • Mandating new variables • Recommendations to improving the quality of insurer data on key variables Eg National Return to Work Monitor (e.g. Campbell Research & Consulting) • Modify existing and include additional variables • Improve survey design and sampling
Approach 2 – Collecting new data • Recognising that outcome in workers compensation reflects the inter-relationships between key stakeholders suggests several supplementary data collection strategies to understand their impact: • Eg - Employer, insurer and provider surveys Eg- multidimensional case studies using the injury event as the point of sampling over the course of recovery from Return to Work exploring over time: • willingness to RTW • capacity to RTW • attitudes to RTW • relationships between stakeholders • attitudes towards interventions
A complication ………. importance of work health will be more than ever • Longer working life • Any addition to retirement age would give a material one-off increase in workers compensation costs (and liabilities?) depending on benefit structure. • Would possibly increase nature & condition and latent claims • Increased incidence of chronic disease in the workplace • Complex and chronic disease prevalence (eg mental illness, diabetes, arthritis, cardiac disease, respiratory disease) is increasing, and increases with advancing age. The workplace (and workers compensation) will need to deal with these
Work health (cont) • Fitness for duty issues (could go two ways) • With change in physical and mental capacity, exposure to disease (eg stress, chemical exposure) and injury (eg musculo-skeletal strain) in some jobs may functionally increase (ie people don’t cope as well, exposure goes on for longer ‘working lifetime’) • Alternatively, exposure may actually decrease if people start to move to other work areas through earlier retraining etc (eg construction field job vs desk job), particularly in the face of “smart” strategies to target markets and skills shortages (eg ‘grey tellers’ for banks to better match the population of customers • Retaining skilled workers • The Finland experience several decades ago is interesting in this regard. The aging bump and the early retirement of affluent societies hit there some time ago, with a consequent looming huge skills gap
The case study approach – holistic analysis examining the injury event from all perspectives
Conclusions • Effect of claim streaming and risk profiling is limited – because of the data available • A new approach is difficult – mainly because of the paradigm we are working in • But…. The paradigm needs revisiting if we are to move forward