Download
1 / 1
10 likes | 112 Views
UNDERSTANDING DYNAMIC BEHAVIOR OF EMBRYONIC STEM CELL MITOSIS Shubham Debnath 1 , Bir Bhanu 2. ABSTRACT. METHODS. RESULTS.

E N D
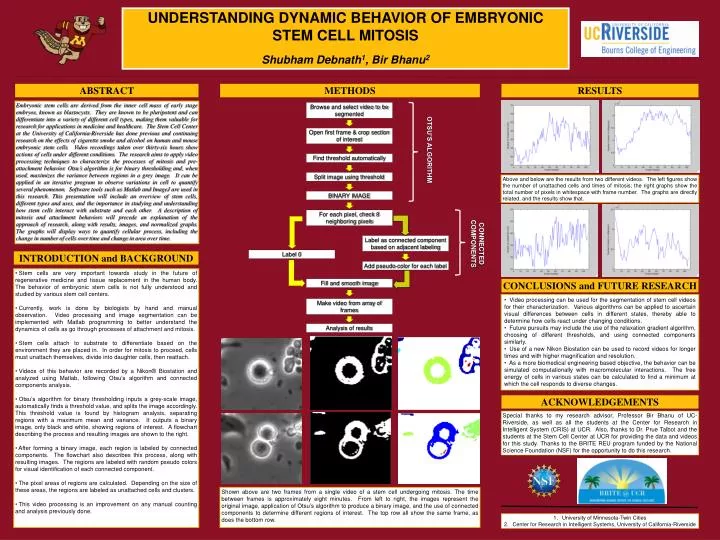
UNDERSTANDING DYNAMIC BEHAVIOR OF EMBRYONIC STEM CELL MITOSIS Shubham Debnath1, Bir Bhanu2 ABSTRACT METHODS RESULTS Embryonic stem cells are derived from the inner cell mass of early stage embryos, known as blastocysts. They are known to be pluripotent and can differentiate into a variety of different cell types, making them valuable for research for applications in medicine and healthcare. The Stem Cell Center at the University of California-Riverside has done previous and continuing research on the effects of cigarette smoke and alcohol on human and mouse embryonic stem cells. Video recordings taken over thirty-six hours show actions of cells under different conditions. The research aims to apply video processing techniques to characterize the processes of mitosis and pre-attachment behavior. Otsu’s algorithm is for binary thresholding and, when used, maximizes the variance between regions in a grey image. It can be applied in an iterative program to observe variations in cell to quantify several phenomenon. Software tools such as Matlab and ImageJ are used in this research. This presentation will include an overview of stem cells, different types and uses, and the importance in studying and understanding how stem cells interact with substrate and each other. A description of mitosis and attachment behaviors will precede an explanation of the approach of research, along with results, images, and normalized graphs. The graphs will display ways to quantify cellular process, including the change in number of cells over time and change in area over time. Browse and select video to be segmented Open first frame & crop section of interest OTSU’S ALGORITHM Find threshold automatically Split image using threshold Above and below are the results from two different videos. The left figures show the number of unattached cells and times of mitosis; the right graphs show the total number of pixels in whitespace with frame number. The graphs are directly related, and the results show that. BINARY IMAGE For each pixel, check 8 neighboring pixels CONNECTED COMPONENTS Label as connected component based on adjacent labeling Label 0 INTRODUCTION and BACKGROUND Add pseudo-color for each label • Stem cells are very important towards study in the future of regenerative medicine and tissue replacement in the human body. The behavior of embryonic stem cells is not fully understood and studied by various stem cell centers. • Currently, work is done by biologists by hand and manual observation. Video processing and image segmentation can be implemented with Matlab programming to better understand the dynamics of cells as go through processes of attachment and mitosis. • Stem cells attach to substrate to differentiate based on the environment they are placed in. In order for mitosis to proceed, cells must unattach themselves, divide into daughter cells, then reattach. • Videos of this behavior are recorded by a Nikon® Biostation and analyzed using Matlab, following Otsu’s algorithm and connected components analysis. • Otsu’s algorithm for binary thresholding inputs a grey-scale image, automatically finds a threshold value, and splits the image accordingly. This threshold value is found by histogram analysis, separating regions with a maximum mean and variance. It outputs a binary image, only black and white, showing regions of interest. A flowchart describing the process and resulting images are shown to the right. • After forming a binary image, each region is labeled by connected components. The flowchart also describes this process, along with resulting images. The regions are labeled with random pseudo colors for visual identification of each connected component. • The pixel areas of regions are calculated. Depending on the size of these areas, the regions are labeled as unattached cells and clusters. • This video processing is an improvement on any manual counting and analysis previously done. CONCLUSIONS and FUTURE RESEARCH Fill and smooth image • Video processing can be used for the segmentation of stem cell videos for their characterization. Various algorithms can be applied to ascertain visual differences between cells in different states, thereby able to determine how cells react under changing conditions. • Future pursuits may include the use of the relaxation gradient algorithm, choosing of different thresholds, and using connected components similarly. • Use of a new Nikon Biostation can be used to record videos for longer times and with higher magnification and resolution. • As a more biomedical engineering based objective, the behavior can be simulated computationally with macromolecular interactions. The free energy of cells in various states can be calculated to find a minimum at which the cell responds to diverse changes. Make video from array of frames Analysis of results ACKNOWLEDGEMENTS Special thanks to my research advisor, Professor Bir Bhanu of UC-Riverside, as well as all the students at the Center for Research in Intelligent System (CRIS) at UCR. Also, thanks to Dr. Prue Talbot and the students at the Stem Cell Center at UCR for providing the data and videos for this study. Thanks to the BRITE REU program funded by the National Science Foundation (NSF) for the opportunity to do this research. Shown above are two frames from a single video of a stem cell undergoing mitosis. The time between frames is approximately eight minutes. From left to right, the images represent the original image, application of Otsu’s algorithm to produce a binary image, and the use of connected components to determine different regions of interest. The top row all show the same frame, as does the bottom row. • University of Minnesota-Twin Cities • Center for Research in Intelligent Systems, University of California-Riverside