Download
1 / 13
130 likes | 206 Views
Property Tax Cap Implementation. July 26, 2011. Components of the Tax Cap. Effective for 2012 county fiscal year -- Lower of 2 percent or inflation For 2012 we expect this to be 2 percent. Components of the Tax Cap. Exclusions from the cap

E N D
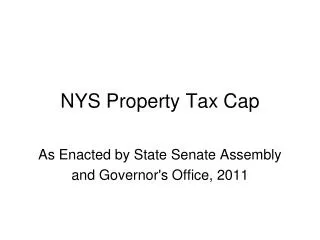
Property Tax Cap Implementation July 26, 2011
Components of the Tax Cap • Effective for 2012 county fiscal year -- Lower of 2 percent or inflation • For 2012 we expect this to be 2 percent
Components of the Tax Cap • Exclusions from the cap • Legal settlements in excess of 5 percent of the general fund • Pension growth costs in excess of 2 percent of the “system average actuarial contribution rate” • For Example, if this law were in place for our 2011 budgets: • 2010 to 2011 average contribution rate growth was 4.4% (increasing from 11.9% to 16.3%), therefore • 2.4% of the total pension increase would not count against the cap limit (proportionately, just over half of the pension cost increase for 2011)
Components of the Tax Cap • No exemptions for capital costs except school districts • No exemptions for state mandated costs • No exemptions for health and safety reasons or environmental compliance • PILOTS will be subject to the levy limitation • In effect, growth in a PILOT that exceeds 2 percent will have to be absorbed into the overall 2 percent cap limitation
Components of the Tax Cap • Includes an Economic growth factor adjustment • Computed by NYS Department of Taxation and Finance, Office of Real Property Tax Services (ORPTS) • The “Quantity Change Factor” is intended to capture normal economic growth in a community and keep it outside the cap limit
Components of the Tax Cap • Allows unused cap growth to be carried over in the next year, not to exceed 1.5% of the total tax levy limit for that year • Carryover will first be allowed in 2013
Components of the Tax Cap • Property tax levy limit applies to: • Taxes imposed on real property on behalf of a county, city, town, village, school district or special districts, • Special ad valorem levies and special assessments, This could include property taxes assessed related to water and sewer and other similar services, but a final determination is pending
Components of the Tax Cap • Each County will have responsibility for calculating its tax levy limitation • Using state data from the State Comptroller related to pensions, and • The Quantity Change Factor provided by NYS Taxation and Finance • Each County is required to submit their levy limitation calculation to the State Comptroller prior to adopting their budget • State Comptroller does not certify local levy calculations, but there is an expectation that any errors will be reported back to a county
Components of the Tax Cap • Override • 60 percent weighted vote of local governing body is necessary to override the cap • This must be approved by a separate local law prior to the enactment of the local budget • A local budget that includes a levy greater the allowable amount can be enacted with a simple majority vote
2% Tax Cap≠State Mandated Cost Growth* • In 2012, a 2% property tax cap would allow the statewide county tax levy to grow by $90 million • The 9 major state mandates counties must administer and pay for, with virtually no ability to control costs, will grow by $279 million in 2012 • State mandated growth in costs for counties is more than 3 times the level allowed under a 2% cap – only a small portion of pension costs may be exempt
Reality of 2% Tax Cap vs. 5-Year Average Annual Growth in 9 State Mandates • Medicaid 2.5% • Pensions (‘09-’13) 31.0% • TANF (-1%) • Safety Net 5.6% • Child Welfare 2.0% • Special Ed. Pre-K 8.0% • Early Intervention 7.7% • Indigent Defense 5.5% • Probation 6.2% • Youth Detention 6.9%
Reality of 2012 Adopted Tax Cap vs. Cost Growth in 9 State Mandates 2% TAX CAP