Download
1 / 16
160 likes | 369 Views
Demonstration of Target Vibration Estimation in Synthetic Aperture Radar Imagery. Qi Wang 1,2 , Matthew Pepin 1,2 , Ryan J. Beach 2 , Ralf Dunkel 3 , Tom Atwood 2,4 , Armin W. Doerry 4 , Balu Santhanam 2 , Walter Gerstle 5 , and Majeed M. Hayat 1,2.

E N D
Demonstration of Target Vibration Estimation in Synthetic Aperture Radar Imagery Qi Wang1,2, Matthew Pepin1,2, Ryan J. Beach2, Ralf Dunkel3, Tom Atwood2,4, Armin W. Doerry4, Balu Santhanam2, Walter Gerstle5, and Majeed M. Hayat1,2 • 1Center for High Technology Materials, University of New Mexico, Albuquerque, NM, 87131 USA • 2Depart. of Electrical and Computer Science, University of New Mexico, Albuquerque, NM, 87131 USA • 3General Atomics Aeronautics Systems, Inc., San Diego, CA 92064 USA • 4Sandia National Laboratories, Albuquerque, NM 87185 USA • 5Depart. of Civil Engineering, University of New Mexico, Albuquerque, NM, 87131 USA
Content • Motivation • Signal model • Algorithm development • The discrete fractional Fourier transform • Experimental results • Performance analysis • Conclusions
Motivation • Vibration signatures associated with objects such as active structures (e.g. bridges and buildings) and vehicles can bear vital information about the type and integrity of these objects • The ability of remote sensing target vibrations is important: • Avoids the cost of acquiring and installing accelerometers on remote structures • Enables sensing vibrations of structures that not easily accessible • Synthetic aperture radar has the potential due to its active illumination feature
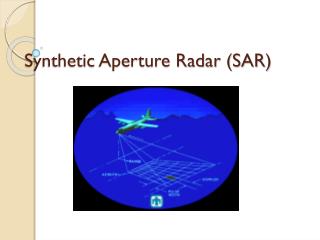
Data collection positions Platform height Azimuth direction Range direction Synthetic Aperture Radar A single static target A single vibrating target The image is generated by the Lynx system built by General Atomics Aeronautical Systems. Inc
Micro-Doppler effect RF pulse: X0 y (azimuth) Frequency (Hz) t (sec) Doppler frequency caused by both the plane’s motion and target vibration Doppler frequency caused by the plane’s motion
Signal model • σ : reflectivity of the vibrating scatterer • fc: carrier frequency • c: speed of the microwave • V: speed of the antenna • y: azimuth position of the vibrating scatterer • fprf: the pulse repetition frequency • rd[n]: time-varying range of the vibrating scatterer • φ: other (constant) phase terms • NI: total number of pulses • The Taylor series expansion is applied to rd[n] in a short time window starting at m, the signal in the time window is approximately: The SAR phase history is de-ramped and reformatted; autofocus is performed if necessary. The signal from a vibrating scatterer after range compression is:
The discrete fractional Fourier transform • Uses a new parameter α to exploit the linear time-frequency relation of the signal (equals to DFT for α = π/2) • Concentrates a linear chirp into a few coefficients we obtain an impulse-like transform analogous to what the discrete Fourier transform produces for a sinusoid. Intersection for α = π/2 The DFRFT of a complex-valued signal containing two component: a pure 150 Hz sinusoid and a chirp with a center frequency of 200 Hz and chirp rate of 400 Hz/s.
The DFRFT (cont’d) Let W denote the transformation matrix of the centered-DFT, the fractional power of W is defined as where vpis the pth column vector of VG. J. G. Vargas-Rubio and B. Santhanam, “On the multiangle centered discrete fractional Fourier transform,” IEEE signal Processing Letters, vol. 12, pp. 273-276, 2005 The DFRFT of a signal x[n] is the DFT of an intermediate signal for each index k (k = 0,1, …,N-1), that is where r = 0,1,…,N-1 is the newly introduced angular index and α=2πr/N. The intermediate signal is calculated by
Incorporating the chirp z-transform Left: regular DFRFT; right: CZT-incorporated DFRFT with a zoom-in factor of 2 • The CZT can be easily incorporated into the DFRFT to provide a fine resolution in estimating the angular position of the peak. • The relation between the peak location and the chirp rate is
Vibration estimation procedure • Demodulate and re-format the SAR phase history, perform autofocus; • Apply range compression to the SAR phase history, identify the signal from the vibrating scatterer; • For all m = 0 to m = N – Nw + 1 do Apply the DFRFT to the signal of interest in each time window and calculate the vibration acceleration via • End for • Reconstruct the history of the vibration acceleration and calculate its DFT spectrum
Experiment static targets Vibrating target • Aluminum triangular trihedral with lateral length of 15 inches • The vibration is caused by the rotation of an unbalanced mass. • Vibration magnitude: 1.5 mm; vibration frequency: 5 Hz SAR image of the test ground near Julian, CA. It was generated by the Lynx system on 2010.
Experiment: the DFRFT spectra The changing of position of the peak in the DFRFT plain indicates a time-varying vibration acceleration of the target. Angle (rad) Frequency (Hz)
Estimation results Estimated vibration acceleration (x: time (s); y: acceleration ( m/s2) Estimated DFT spectrum of the vibration (x: frequency (Hz); y: magnitude (AU) Actual vibration frequency: 5 Hz
Performance analysis The vibration frequency resolution is limited by the SAR observation time of the target For the Lynx system, it ranges from 0.3 Hz to 1.0 Hz depending on the data collection geometry and the radar cross section of the target. The maximum measurable vibration frequency is upper-bounded by fprf/2 theoretically In practice, vibration frequencies up to 25 Hz can be easily estimated when fprf = 1000 Hz;
Conclusions A DFRFT-based method is proposed for SAR vibration estimation In the experiment, the proposed method successfully estimated a 1.5 mm, 5-Hz vibration from a corner reflector Performance analysis of the proposed method is carried out in terms of vibration frequency resolution and maximum measurable vibration frequency
Acknowledgement This work was supported by the United States Department of Energy (Award No. DE-FG52-08NA28782), the National Science Foundation (Award No. IIS-0813747), National Consortium for MASINT Research, and Sandia National Laboratories. The authors also thank GA-ASI for making the Lynx system available to this project.