Download
1 / 19
190 likes | 285 Views
The IMAP Hybrid Method for Learning Gaussian Bayes Nets. Oliver Schulte School of Computing Science Simon Fraser University Vancouver, Canada oschulte@cs.sfu.ca. with Gustavo Frigo, Hassan Khosravi (Simon Fraser) and Russ Greiner (U of Alberta). Outline. Brief Intro to Bayes Nets (BN)

E N D
The IMAP Hybrid Method for Learning Gaussian Bayes Nets Oliver Schulte School of Computing Science Simon Fraser UniversityVancouver, Canada oschulte@cs.sfu.ca with Gustavo Frigo, Hassan Khosravi (Simon Fraser) andRuss Greiner (U of Alberta)
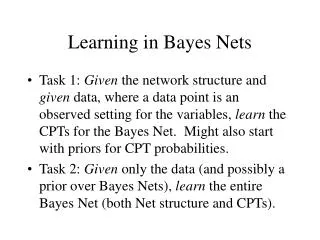
Outline • Brief Intro to Bayes Nets (BN) • BN structure learning: Score-based vs. Constraint-based. • Hybrid Design: Combining Dependency (Correlation) Information with Model Selection. • Evaluation by Simulations
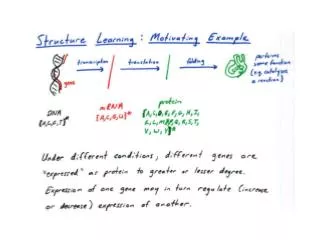
Bayes Nets: Overview • Bayes Net Structure = Directed Acyclic Graph. • Nodes = Variables of Interest. • Arcs = direct “influence”, “association”. • Parameters = CP Tables = Prob of Child given Parents. • Structure represents (in)dependencies. • (Structure + parameters) represents joint probability distribution over variables. • Many applications: Gene expression, finance, medicine, …
Example: Alienation Model Anomia67 Powerless67 Anomia71 Powerless71 Alienation67 Alienation71 SES Education SEI • Wheaton et al. 1977. Structure entails (in)dependencies: • Anomia67 dependent on SES. • Education independent of any node given SES • Can predict any node, e.g. “Probability of Powerless67 = x, given SES = y?”
Gaussian Bayes Nets • aka(recursive) structural equation models. • Continous variables. • Each child is linear combination of parents, plus normally distributed error ε (mean 0). • E.g. Alienation71 = 0.61*Alienation67 -0.23 SES + ε ε 0.61 Alienation67 Alienation71 -0.23 SES
A A B B Two Approaches to Learning Bayes Net Structure Input: random sample Search and Score Constraint-Based (CB) • use statistical correlation test (e.g., Fisher’s z) to find (in)dependencies. • choose G that entails (in)dependencies in sample. • Select graph G as model with parameters to be estimated • score BIC, AIC • balances data fit with model complexity Score = 5 Covers correlation between A and B Score = 10
Overfitting with Score-based Search Anomia67 Powerless67 Anomia71 Powerless71 Alienation67 Alienation71 TargetModel SES Education SEI Anomia67 Powerless67 Anomia71 Powerless71 Alienation67 Alienation71 BICModel SES Education SEI
Overfitting with Score-based Search • Generate random parametrized graphs with different sizes, 30 graphs for each size. • Generate random samples of size 100-20,000. • Use Bayes Information Criterion (BIC) to learn.
C d = sample New idea B 10.5 S A G S(G,d) = score function. Case 1 Case 2 Case 3 Our Hybrid Approach Score-based: produces overly dense graphs cross-check score with dependencies CB: weakness is type II error,false acceptance of independencies. use only dependenciesSchulte et al. 2009 IEEE CIDM • Let Dep be a set of conditional dependencies extracted from sample d. • Move from graph G to G’ only if • score increases: S(G’,d) > score(G,d) and • G’ entails strictly more dependencies from Dep than G.
C A A B Example for Hybrid Criterion score C 20 • The score prefers thedenser graph. • The correlation between B and C is not statistically significant. • So the hybrid criterion prefers the simpler graph. B Dep(A,B),Dep(A,B|C) test sample 10 score
Adapting Local Search apply local search operator to maximize score while covering additional dependencies current graph new graph test n2 Markov blanket dependencies: is A independent of B given the Markov blanket of A?n= number of nodes Dep(A,B),Dep(A,B|C),Dep(B,C) test sample • any local search can be used • inherits convergence properties of local search if test is correct in the sample size limit
Simulation Setup (key results) • Statistical Test: Fisher z-statistic, = 5% • Score S: BIC (Bayes information score). • Search Method: GES [Meek, Chickering 2003]. • Random Gaussian DAGs. • #Nodes: 4-20. • Sample Sizes 100-20,000. • 30 random graphs for each combination of node number with sample size, average results. • Graphs generated with Tetrad’s random DAG utility (CMU).
Simulation Results: Number of Edges • Edge ratio of 1 is ideal.GES = standard score search. IGES = hybrid search. • Improvement = ratio(GES) – ratio(IGES).
Simulation Results: f-measure f-measure on correctly placed links combines false positives and negatives: 2 correctly placed/ (2 correctly placed + incorrectly placed + missed edges.) Structure fit improves most for >10 nodes.
Real-World Structures: Insurance and Alarm • Alarm (Beinlich et al. 1989)/Insurance (Binder et al.) 37/25 nodes. • Average over 5 samples per sample size. • F-measure, higher is better.
False Dependency Rate type I error (false correlations) rare,frequency less than 3%.
False Independency/Acceptance Rate • type II error (false independencies) are quite frequent. • e.g., 20% for sample size 1,000.
Conclusion • In Gaussian BNs, score-based methods tend to produce overly dense graphs for >10 variables. • Key new idea: constrain search s.t. adding edges is justified by fitting more statistically significant correlations. • Also: use only dependency information, not independencies (rejections of null hypothesis, not acceptances). • For synthetic and real-world target graphs finds less complex graphs, better fit to target graph.
The End Thank you! full paper