Download
1 / 36
360 likes | 578 Views
Solid Waste and Recycling. Chris Newman Environmental Scientist USEPA . Overview. Overview of Waste in America Waste and Recycling 101 Relating Waste to Climate Change Consequences of Landfill. Overview of Waste in America. Solid Waste Generation. 2009 MSW figures

E N D
Solid Waste and Recycling Chris Newman Environmental Scientist USEPA
Overview • Overview of Waste in America • Waste and Recycling 101 • Relating Waste to Climate Change • Consequences of Landfill
Solid Waste Generation • 2009 MSW figures • 243 million tons of waste generated • 135 million tons disposed in a landfill • 82 million tons recycled • 29 million tons combusted • 4.5 lbs/person/day generated • 33.2% national recovery rate • 40% generated outside home • Parks, sports arenas, transportation systems, shopping centers If every American recycled just one plastic beverage bottle while ‘on the go,’ we could prevent the disposal of more than 8,000 tons of recyclable material This is equivalent to 608 Sears Towers (by weight)!!
Generation (1960 – 2009) http://www.epa.gov/msw/pubs/ex-sum05.pdf
Recycling (1960 – 2009) http://www.epa.gov/msw/pubs/ex-sum05.pdf
Cook and Surrounding Counties • Counties 9 • Area (square miles) 5,109 • Population (est.) 8,827,903 • Percent of Total Illinois Population 67.8% • 8 Active Landfills as of 2008 • 9 Years of Landfill life expectancy
Recycling: Northeast Region • Cook County: • Generated: 15 million Tons • Recycled: 6 million tons (42.5 % rate) • Recycling can include: Traditional recyclables, Construction & Demolition Debris The Northeast Counties landfilledthe equivalent of 171 Nimitz class aircraft carriers in 2009
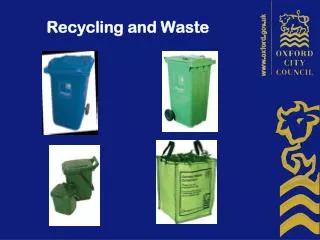
How Waste Flows • Transfer Stations • Landfills • Recycling • Traditional Recyclables • Compost • E-waste
Generator Garbage/RecyclingTruck Transfer Station Long-Haul Garbage Truck Materials Recovery Facility (MRF) Manufacturing Facility Flow Diagram Landfill
Climate Change Overview • Climate Change Background • Connecting Waste to Climate Change
GHGs and Climate Change: Sector-based Approach Sector-Based View of U.S. GHG Emissions (2006) This figure reflects data from the Inventory of U.S. Greenhouse Gas Emissions and Sinks: 1990-2006 (U.S. EPA, 2008), Table 2-12. This figure excludes emissions from U.S. territories, which are not allocated to economic sectors.
The Materials – Climate Connection U.S. GHG Emissions (2006) Source: Opportunities to Reduce Greenhouse Gas Emissions through Materials and Land Management Practices, U.S. EPA, September 2009, www.epa.gov/oswer/docs/ghg_land_and_materials_management.pdf
Connecting Waste to Climate Change http://www.epa.gov/climatechange/wycd/waste/downloads/execsum.pdf
Current Benefits of Recycling • Energy Benefits: 1.3 quadrillion BTU • Equivalent to 224 million barrels of oil • Climate Benefits: 178 million MTCO2e • Equivalent to emissions from 33 million cars
Consequences of Landfill • Leachate • Gas and Odors • Groundwater • Reactive Wastes
Leachate Leachate Seeps
Gas and Odors Offsite Monitoring
Groundwater Groundwater Remediation
Pacific Garbage Patch • The garbage patch is located in a remote area of the North Pacific Tropical Gyre • The clockwise motion of the ocean’s currents brings sea debris/garbage to this area from all over the ocean, most of which is plastic. • The garbage patch is roughly two times the size of Texas.
http://merosoch.com/wp-content/uploads/2010/07/pacific-garbage-patch1.jpghttp://merosoch.com/wp-content/uploads/2010/07/pacific-garbage-patch1.jpg
There are Others! Indian Ocean Patch Atlantic Ocean Patch
What is Being Done? • EPA is working with NOAA to develop coastal Debris Management Plans • identifying sources of marine debris • developing recommendations to mitigate sources of Marine Debris • Private and non-profit organizations are researching possible clean-up options • i.e. Project Kaisei