Download
1 / 13
130 likes | 135 Views
This study examines the rapid growth of cyclo-oxygenase-2 (COX2) inhibitors in the non-steroidal anti-inflammatory drug (NSAID) market and its impact on hospital cost containment policies. It analyzes variations in NSAID expenditures and patterns of drug channeling in 18 provincial hospitals in Thailand. The study also explores factors influencing the use of COX2 inhibitors.

E N D
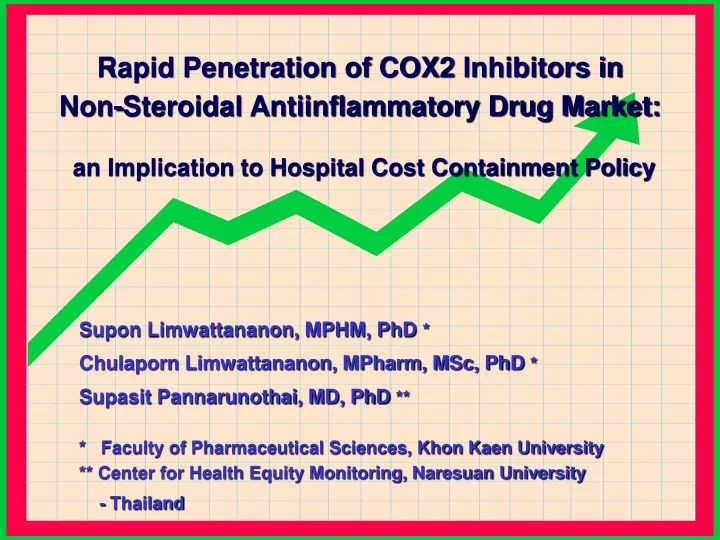
Rapid Penetration of COX2 Inhibitors in Non-Steroidal Antiinflammatory Drug Market: an Implication to Hospital Cost Containment Policy Supon Limwattananon, MPHM, PhD * Chulaporn Limwattananon, MPharm, MSc, PhD * Supasit Pannarunothai, MD, PhD ** * Faculty of Pharmaceutical Sciences, Khon Kaen University ** Center for Health Equity Monitoring, Naresuan University - Thailand
Abstracts Problem Statement: Since their 1999 launch claiming few gastrointestinal side effects, cyclo-oxygenase-2 (COX2) inhibitors have become a market competitor with conventional non-steroidal antiinflammatory drugs (NSAIDs). Objectives: To examine variations in NSAID expenditures as related to the use of COX2 inhibitors and to assess patterns of drug channeling in the hospital drug market. Design: Retrospective, secondary analysis of electronic drug use databases. Setting and Population: Eighteen provincial hospitals in Thailand. A total of 1,558,633 prescriptions for oral NSAID solid dosage forms given to ambulatory patients from 2000 to 2002. Outcome Measures: Total and per patient, quarterly and annual expenditures in Thai Baht; % of expenditures and prescriptions for COX2 inhibitors; number of daily doses of drugs prescribed; odds ratios (OR) for receiving COX2 inhibitors. Results: In total, NSAID expenditures increased by 47.6% from 23.2 million Baht in 2000 to 34.3 million Baht in 2001, then increased slightly after implementation of Universal Health Care Coverage (UC) scheme to 38.0 million Baht in 2002. Part of this rapid growth was driven by pricing. Expenditures for COX2 inhibitors increased dramatically from 6.5% in the first quarter of 2000 to 52.1% in the last quarter of 2002, and the prescription share gradually increased from 0.5% to 4.6% during the same period. Use of COX2 inhibitors rather than other NSAIDs would raise the annual expenditures per person as much as 1,101.2% (P<0.001), using a generalized linear model. The utilization components did not show a consistent pattern across health insurance schemes of drug recipients. Based on logistic regression analysis, patients covered by the Civil Servant Medical Benefit Scheme (CSMBS) were 9.7-13.2 and 15.6-23.1 times (P<0.001) more likely to receive COX2 inhibitors in a year than Social Security Scheme (SSS) and UC beneficiaries, respectively. An analysis of the intensity-of-use component for the NSAID recipients who visited the hospitals in three consecutive years revealed a relatively longer period of COX2 inhibitor use for CSMBS patients as compared to the patients in SSS and UC schemes. Conclusions: Growth in NSAID expenditures was largely driven by rapid penetration of the expensive COX2 inhibitors. The prime target for these patent-protected, single-source products was fee-for-service schemes like CSMBS. To contain hospital drug costs with a generic substitution for COX2 inhibitors is unfeasible due to the market exclusivity of the drugs. Therapeutic substitution with the multi-source NSAID seems to be a viable alternative in curbing NSAID expenditure growth.
Objectives • 1. To examine variations in hospital NSAID expenditures as related to • the use of COX2 inhibitors • 2. To assess patterns of drug channeling for COX2 inhibitors • Design and Analysis • Retrospective, secondary analysis of electronic databases • Settings18 MOPH-provincial hospitals in 4 regions of Thailand • Sample1,558,633 prescriptions for oral NSAID solid forms • rendered to ambulatory patients during fiscal years 2000 - 2002 • Statistical analysis • For drug expenditures: a generalized linear model (GLM) • For propensity of drug use: logistic regression analysis • Control for the underlying differences in drug use patterns due to • age groups and gender • years of drug use (and interaction with health insurance schemes) • hospital settings (proxy for variations in prescribing practice styles)
Number of Prescriptions for NSAID Rxs 4.0% 4.6% 2.6% 0.5% COX2 inhibitors Other NSAID-NED Meloxicam Other NSAID-ED
Expenditures by types of NSAID Baht COX2 inhibitors 33.9% 52.1% 46.5% 6.5% Other NSAID-NED Meloxicam Other NSAID-ED
Factors Affecting NSAID Expenditures per Capita(Competing Models) Model with interaction terms Main effect model Coefficienta P value Coefficienta P value COX2 inhibitors 2.486 < 0.001 2.488 < 0.001 Age 36 – 49 years b 0.368 < 0.001 0.370 < 0.001 Age 50+ years b 0.798 < 0.001 0.805 < 0.001 Male - 0.158 < 0.001 - 0.158 < 0.001 CSMBS c 0.864 < 0.001 0.847 < 0.001 LIC/UC c - 0.001 0.954 - 0.053 < 0.001 ROP c - 0.022 0.188 - 0.084 < 0.001 Year 2001 d - 0.035 0.065 0.038 < 0.001 Year 2002 d 0.186 < 0.001 0.025 0.002 CSMBS x Year 2001 0.083 0.002 CSMBS x Year 2002 - 0.093 < 0.001 LIC/UC x Year 2001 0.123 < 0.001 LIC/UC x Year 2002 - 0.205 < 0.001 ROP x Year2001 0.070 0.002 ROP x Year2002 - 0.249 < 0.001 a Based on generalized linear model (GLM) using log link, gamma distribution , adjusted for hospital indicators b Age of 18-35 years as the reference category c SSS as the reference category d Year 2000 as the reference category
Effects on Difference in NSAID Expenditure % difference a 95% CI COX2 inhibitors 1,101.2% 1,056.5 to 1,147.6% vs. other NSAID Age 36-49 years 44.5% 42.3 to 46.7% vs. 18-35 years Age 50+ years 122.0% 118.5 to 125.6% vs. 18-35 years Male -14.6% - 15.7 to -13.5% vs. Female a % difference due to an indicator variable = exp(Coefficient) - 1
Effects on Difference in NSAID Expenditure (Trends for Each Scheme) % difference a LIC/UC SSS ROP CSMBS Year 2001 vs. 9.2% -3.4% 3.5% 4.9% Year 2000 Year 2002 vs. -1.9% 20.4% -6.1% 9.7% Year 2000 a % difference due to an indicator variable = exp(Coefficient) - 1 Based on GLM with interaction of schemes and years
Effects on Difference in NSAID Expenditure (Comparison between Schemes for Each Year) % difference a Year 2000 Year 2001 Year 2002 CSMBS vs. SSS 137.2% 157.7% 116.1% ROP vs. SSS -2.2% 4.9% -23.7% LIC/UC vs. SSS -0.1% 13.0% -18.6% a % difference due to an indicator variable = exp(Coefficient) - 1 Based on GLM with interaction of schemes and years
Propensity to Receive COX2 Inhibitors(Competing Models) Model with interaction terms Main effect model Coefficienta P value Coefficienta P value Age 36 – 49 years b 0.619 < 0.001 0.617 < 0.001 Age 50+ years b 1.267 < 0.001 1.270 < 0.001 Male - 0.302 < 0.001 - 0.301 < 0.001 CSMBS c 2.279 < 0.001 2.434 < 0.001 LIC/UC c - 0.845 < 0.001 - 0.585 < 0.001 ROP c - 0.407 < 0.001 0.178 < 0.001 Year 2001 d 1.105 < 0.001 1.200 < 0.001 Year 2002 d 1.145 < 0.001 1.512 < 0.001 CSMBS x Year 2001 - 0.009 0.936 CSMBS x Year 2002 0.303 0.003 LIC/UC x Year 2001 0.367 0.009 LIC/UC x Year 2002 0.285 0.038 ROP x Year2001 0.461 < 0.001 ROP x Year2002 0.853 < 0.001 a Based on logistic regression analysis, adjusted for hospital indicators b Age of 18-35 years as the reference category c SSS as the reference category d Year 2000 as the reference category
Odds of Receiving COX2 Inhibitors CSMBS Odds* (in log scale) SSS ROP LIC/UC * Odds = exp(constant+bAge+bGender+bScheme+bYear+bSchemexYear+bHosp)
Odds Ratio of Receiving COX2 Inhibitors(Comparison between Schemes for Each Year) Odds Ratio a Year 2000 Year 2001 Year 2002 CSMBS vs. LIC/UC 22.74 15.62 23.14 CSMBS vs. SSS 9.77 9.68 13.22 ROP vs. LIC/UC 1.55 1.70 2.73 LIC/UC vs. SSS 0.43 0.62 0.57 a Based on logistic regression model with interaction of schemes and years
Conclusion • Growth in NSAID expenditures was largely driven by • rapid penetration of the expensive COX2 inhibitors. • The prime target for the patent-protected, single-source drugs • was patients covered by fee-for-service scheme like CSMBS. • To contain hospital drug costs, a generic substitution for • COX2 inhibitors is unfeasible due to market exclusivity nature. • Therapeutic substitution with the multi-source NSAID is • a viable alternative in curbing the expenditure growth.