Download
1 / 47
470 likes | 722 Views
Model Checking. Using residuals to check the validity of the linear regression model assumptions. The simple linear regression model. The mean of the responses, E(Y i ), is a l inear function of the x i . The errors, ε i , and hence the responses Y i , are i ndependent .

E N D
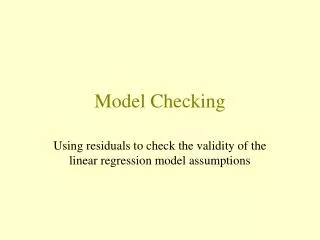
Model Checking Using residuals to check the validity of the linear regression model assumptions
The simple linear regression model • The mean of the responses, E(Yi), is a linear function of the xi. • The errors, εi, and hence the responses Yi, are independent. • The errors, εi, and hence the responses Yi, are normally distributed. • The errors, εi, and hence the responses Yi, have equal variances (σ2) for all x values.
The simple linear regression model Assume (!!) response is linear function of trend and error: with the independent error terms i following a normal distribution with mean 0 and equal variance 2.
Why do we have to check our model? • All estimates, intervals, and hypothesis tests have been developed assuming that the model is correct. • If the model is incorrect, then the formulas and methods we use are at risk of being incorrect.
When should we worry most? • All tests and intervals are very sensitive to • departures from independence. • moderate departures from equal variance. • Tests and intervals for β0 and β1 are fairly robustagainst departures from normality. • Prediction intervals are quite sensitive to departures from normality.
What can go wrong with the model? • Regression function is not linear. • Error terms are not independent. • Error terms are not normal. • Error terms do not have equal variance. • The model fits all but one or a few outlier observations. • An important predictor variable has been left out of the model.
The basic idea of residual analysis The observed residuals: should reflect the properties assumed for the unknown true error terms: So, investigate the observed residuals to see if they behave “properly.”
The sample mean of the residuals ei is always 0. x y RESIDUAL 1 9 1.60825 1 7 -0.39175 1 8 0.60825 2 10 -1.04639 3 15 0.29897 3 12 -2.70103 4 19 0.64433 5 24 1.98969 5 21 -1.01031 --------- 0.00001 (round-off error)
A residuals vs. fits plot • A scatter plot with residuals on the y axis and fitted values on the x axis. • Helps to identify non-linearity, outliers, and non-constant variance.
Characteristics of a well-behaved residual vs. fits plot • The residuals “bounce randomly” around the 0 line. (Linear is reasonable). • No one residual “stands out” from the basic random pattern of residuals. (No outliers). • The residuals roughly form a “horizontal band” around 0 line. (Constant variance).
A residuals vs. predictor plot • A scatter plot with residuals on the y axis and the values of a predictor on the x axis. • If the predictor on the x axis is the same predictor used in model, offers nothing new. • If the predictor on the x axis is a new and different predictor, can help to determine whether the predictor should be added to model.
A residuals vs. predictor plot offering nothing new. (Same predictor!)
Example: What are good predictors of blood pressure? • n = 20 hypertensive individuals • age = age of individual • weight = weight of individual • duration = years with high blood pressure
Residuals (age only) vs. weight plot (New predictor!)
Residuals (age, weight) vs. duration plot (New predictor!)
How a non-linear function shows up on a residual vs. fits plot • The residuals depart from 0 in some systematic manner: • such as, being positive for small x values, negative for medium x values, and positive again for large x values
Example: A linear relationship between tread wear and mileage? mileage groove 0 394.33 4 329.50 8 291.00 12 255.17 16 229.33 20 204.83 24 179.00 28 163.83 32 150.33 X = mileage in 1000 miles Y = groove depth in mils
A residual vs. fits plot suggesting relationship is not linear
How non-constant error variance shows up on a residual vs. fits plot • The plot has a “fanning” effect. • Residuals are close to 0 for small x values and are more spread out for large x values. • The plot has a “funneling” effect • Residuals are spread out for small x values and close to 0 for large x values. • Or, the spread of the residuals can vary in some complex fashion.
Example: How is plutonium activity related to alpha particle counts?
A residual vs. fits plot suggesting non-constant error variance
How an outlier shows up on a residuals vs. fits plot • The observation’s residual stands apart from the basic random pattern of the rest of the residuals. • The random pattern of the residual plot can even disappear if one outlier really deviates from the pattern of the rest of the data.
Example: Relationship between tobacco use and alcohol use? Region Alcohol Tobacco North 6.47 4.03 Yorkshire 6.13 3.76 Northeast 6.19 3.77 EastMidlands 4.89 3.34 WestMidlands 5.63 3.47 EastAnglia 4.52 2.92 Southeast 5.89 3.20 Southwest 4.79 2.71 Wales 5.27 3.53 Scotland 6.08 4.51 Northern Ireland 4.02 4.56 • Family Expenditure Survey of British Dept. of Employment • X = average weekly expenditure on tobacco • Y = average weekly expenditure on alcohol
A residual vs. fits plot suggesting an outlier exists “outlier”
How large does a residual need to be before being flagged? • The magnitude of the residuals depends on the units of the response variable. • Make the residuals “unitless” by dividing by their standard deviation. That is, use “standardized residuals.” • Then, an observation with a standardized residual greater than 2 or smaller than -2 should be flagged for further investigation.
Minitab identifies observations with large standardized residuals Unusual Observations Obs Tobacco Alcohol Fit SE Fit Resid St Resid 11 4.56 4.020 5.728 0.482 -1.708 -2.58R R denotes an observation with a large standardized residual.
Residuals vs. order plot • Helps assess serial correlation of error terms. • If the data are obtained in a time (or space) sequence, a “residuals vs. order” plot helps to see if there is any correlation between error terms that are near each other in the sequence. • A horizontal band bouncing randomly around 0 suggests errors are independent, while a systematic pattern suggests not.
Residuals vs. order plots suggesting non-independence of error terms
Normal (probability) plot of residuals • Helps assess normality of error terms. • If data are Normal(μ, σ2), then percentiles of the normal distribution should plot linearly against sample percentiles (with sampling variation). • The parameters μ and σ2 are unknown. Theory shows it’s okay to assume μ = 0 and σ2 = 1.
Normal (probability) plot of residuals Ordered! x y i RESI1 PCT MTB_PCT NSCORE 3 12 1 -2.70103 0.1 0.060976 -1.54664 2 10 2 -1.04639 0.2 0.158537 -1.00049 5 21 3 -1.01031 0.3 0.256098 -0.65542 1 7 4 -0.39175 0.4 0.353659 -0.37546 3 15 5 0.29897 0.5 0.451220 -0.12258 1 8 6 0.60825 0.6 0.548780 0.12258 4 19 7 0.64433 0.7 0.646341 0.37546 1 9 8 1.60825 0.8 0.743902 0.65542 5 24 9 1.98969 0.9 0.841463 1.00049
Normal (probability) plot of residuals (cont’d) • Plot normal scores (theoretical percentiles) on vertical axis against ordered residuals (sample percentiles) on horizontal axis. • Plot that is nearly linear suggests normality of error terms.
Residual plots in Minitab’s regression command • Select Stat >> Regression >> Regression • Specify predictor and response • Under Graphs… • select either Regular or Standardized • select desired types of residual plots (normal plot, versus fits, versus order, versus predictor variable)
Normal plots outside of Minitab’s regression command • Select Stat >> Regression >> Regression... • Specify predictor and response • Under Storage … • select Regular or Standardizedresiduals • Select OK. Residuals will appear in worksheet. • (Either) Select Graph >> Probability plot… • Specify RESI as variable and select Normal distribution. Select OK. • (Or) Select Stat >> Basic Stat >> Normality Test • SpecifyRESI as variable and select OK.