Download
1 / 28
280 likes | 406 Views
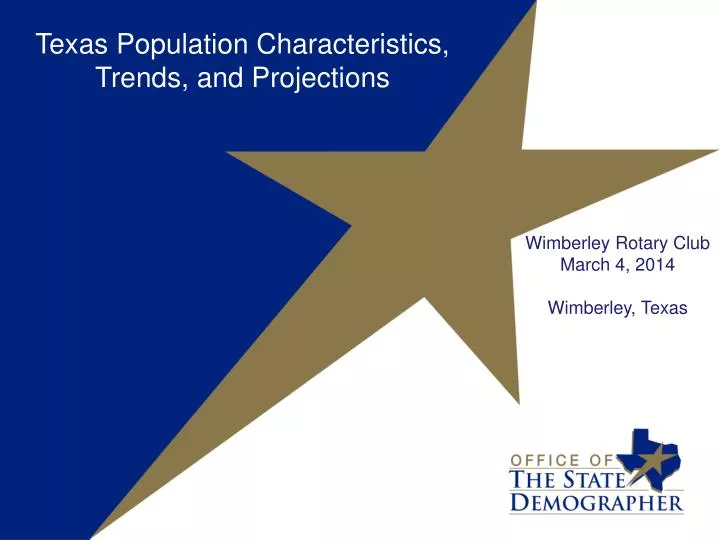
Texas Population Characteristics, Trends, and Projections. Wimberley Rotary Club March 4, 2014 Wimberley , Texas. Growing States, 2000-2010. 65% (2.8 million) of this change can be attributed to growth of the Hispanic population.

E N D
Texas Population Characteristics, Trends, and Projections Wimberley Rotary Club March 4, 2014 Wimberley, Texas
Growing States, 2000-2010 65% (2.8 million) of this change can be attributed to growth of the Hispanic population Source: U.S. Census Bureau. 2000 and 2010 Census Count.
Total Population and Components of Population Change in Texas, 1950-2012
Total Estimated Population by County, 2012 Along and east of I-35: 40% of land 86% of population 92% of population growth (2011-2012) Source: U.S. Census Bureau 2012 Population Estimates
Change of the Total Population by County, 2010 to 2012 96 counties lost population over the two year period Of counties that lost population 90% had net out migration 47% had natural decline Source: U.S. Census Bureau Population Estimates, 2012 Vintage.
The 10 Fastest Growing Metro AreasIncrease from July 1, 2011, to July 1, 2012 Source: U.S. Census Bureau, 2012
The 10 Counties with the Largest Numeric Increase from July 1, 2011, to July 1, 2012 Source: U.S. Census Bureau, 2013
Source: Federal Reserve Bank of Dallas, Texas Economic Indicators, February 2014
Estimated Net Migration Between States and Texas, 2011 Source: U.S. Census Bureau, American Community Survey, 2011One-year Sample
Six states account for 60% of unauthorized immigrants in 2012
Estimates of the Unauthorized Immigrant Population in Texas, 1990-2012 millions Population Decline of Unauthorized Immigrants Stalls, May Have Reversed, www.pewresearch.org/hispanic
Resident Characteristics ofHays County, Texas, 2008-2012 Source: U.S. Census Bureau, American Community Survey, 5 Year Sample 2008-2012
Percent of population aged 25 years and older with high school or greater, census tracts, Texas, 2007-2011 Source: U.S. Census Bureau, American Community Survey, Five-Year Sample, 2007-2011.
Percent of the labor force working in management, business, science, and arts occupations, census tracts, Texas, 2007-2011 Source: U.S. Census Bureau, American Community Survey, Five-Year Sample, 2007-2011.
Percent of households that are female headed with children less than 18 years of age present, no husband present, census tracts, Texas, 2007-2011 Source: U.S. Census Bureau, American Community Survey, Five-Year Sample, 2007-2011.
Texas White (non-Hispanic) and Hispanic Populations by Age, 2010 Source: U.S. Census Bureau 2010 Decennial Census, SF1
Texas Population Pyramid by Race/Ethnicity, 2010 Source: U.S. Census Bureau 2010 Decennial Census, SF1
Texas Population Pyramid by Race/Ethnicity, 2010 Source: U.S. Census Bureau 2010 Decennial Census, SF1
Texas Population Pyramid by Race/Ethnicity, 2010 Source: U.S. Census Bureau 2010 Decennial Census, SF1
Percent Hispanic and Non-Hispanic White, Hays County, Texas, 2012
Projected Population Growth in Texas, 2010-2050 Source: Texas State Data Center 2012 Population Projections
Projected Racial and Ethnic Percent, Texas, 2010-2050 Source: Texas State Data Center 2012 Population Projections , 2000-2010 Migration Scenario
Percent of the Civilian Labor Force (ages 25-64) by Educational Attainment for 2011, 2030 Using Constant Rates, and 2030 Using Trended Rates, Texas Sources: Texas State Data Center, 2012 Vintage Population Projections, 0.5 Migration Scenario U.S. Census Bureau, American Community Survey, Public Use Micro Sample, 2001-2011
Birth rates for teenagers aged 15–19, by race and Hispanic origin of mother: United States and each and state, 2011 SOURCE: CDC/NCHS, Division of Vital Statistics. Preliminary data.
Projected Increase in Obesity in Texas by Ethnicity, 2006 to 2040 Source: Office of the State Demographer projections, using 2000-2004 migration scenario population projections
Percent without health insurance, Texas counties, 2007-2012 Source: U.S. Census Bureau, American Community Survey, 5-year sample, 2007-2012
Contact Office: (512) 463-8390 or (210) 458-6530 Email: Lloyd.Potter@osd.state.tx.us Internet: http://osd.state.tx.us Lloyd Potter, Ph.D.