Download
1 / 14
140 likes | 262 Views
Prometheus Lava-Frost Interaction. Robert R. Howell University of Wyoming. Overview. SO 2 gas generation rates HST SO 2 column density (Jessup et al. 2004) plus numerical plume dynamics (Zhang et al. 2004) plume dynamics Confirms updated ~10 4 kg/s from Ingersoll type models

E N D
Prometheus Lava-Frost Interaction Robert R. Howell University of Wyoming
Overview • SO2 gas generation rates • HST SO2 column density (Jessup et al. 2004) plusnumerical plume dynamics (Zhang et al. 2004) plume dynamics • Confirms updated ~104 kg/s from Ingersoll type models • SO2 erosion rates (m/s as function of time) • From modified lava-flow model or simple energetics • Integration of rates over various age flows • Also modified from lava flow model • Combine above with Galileo SSI 5 m2/s lava on frost spreading rate (Milazzo et al. 2001) to get • Constraints on frost or lava thickness • Comparison of IR and gas power (GW)
Original Calculation – Ingersoll model • Presented in Jessup et al. (2004) with correction in Lellouch et al. (2006) (Jupiter book) • Analytical model where excess pressure (above vapor pressure) drives excess collisions with surface. • Psurface (or column density), T collision rate with surface (per unit area per unit time). • (Sticking coef.), Pvapor excess collision rate (above equil.) • Excess rate area of plume kg/s Updated geometry from Geissler? • Updated value 104 kg/s of SO2
Zhang et al Cross-Section of Plume density • Numerical model follows expansion and condensation of gas (and small plume particles which follow gas) • Shape of plume constrained by Voyager on-the-limb brightness contours (which sense dust). • Model assumes gas characteristics at vent – but are not well constrained by Voyager observations since dust/gas ratio isn’t very certain. Density of gas in plume proportional to assumed vent density. • Can use HST SO2 column density to constrain Zhang model and therefore obtain “independent” estimate of SO2 generation rate.
Zhang et al. 2004 Prometheus SO2density profile • Zhang et al. (2004) SO2 number density normalized to 51016 m-3. • Assumes vent conditions equivalent to 1.6 103 kg/s but poorly constrained
Column density derived from density profile • Column density falls rapidly beyond 15 km radius, with long tail • HST observations have ~300 km spatial resolution (i.e. ~150 km radius) • Horizontal line represents HST value and spatial resolution • Ratio of observed to averaged model is ~5 (so assumed vent gas density too low) • Supply rate = 5 x 1.6 103 kg/s = 8.0103, close to “Ingersoll model” 104 kg/s
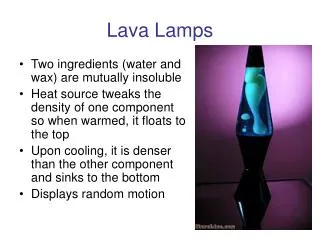
Lava – Frost interaction overview • Assume lava crust in contact with frost (or perhaps liquid) SO2 • Assume lava maintains coherent crust • Same assumption as in Milazzo et al. 2001 • Ignores possibility of violent mixing • Calculate heat out of lava flow using modified “flow model” • Assume all that heat is used to vaporize SO2 • So vaporization rate heat flow / (latent heat of sublimation) • Vaporization rate will vary with time as lava crust thickens and heat flow drops • Mathematics for averaging vaporization rate over different age flows is exactly analogous to mathematics for averaging infrared emission • Final results different because different power laws involved in rates
Heat flow from lava flow • Published Howell (1997) model uses “Stefan solution” to find heat flow and temperature from cooling and solidifying lava flow. • Stefan solution is “exact” if surface of lava is clamped at some T0 • Gives heat flow q(t) through surface, plus interior temperature of lava crust • Flow model makes initial estimate of T0 then uses it to calculate q(t) • Then uses q(t) and radiate boundary condition to refine estimate of surface T(t) • Approximations are even better for lava crust quenched by contact with frost • Only requires minor modification of initial T0 guess (or T Tmelt-T0) • Use T0 198K = triple point temperature of SO2 so T 1200 K • Lava flow model assumed T0 ~ 400K so T 1000 K • Insensitive to exact temperature of boundary since that has little effect on T.
Erosion rates from heat flow • SO2 mass flux from surface (Fm) has similar functional form • Velocity of vaporization wave is just Fm/frost • Integrate velocity to get erosion depth of SO2
Others’ erosion rates • Difference from Milazzo et al. 2001 estimate • This work: • Milazzo et al 200184.4 times less • Factor of 2 could be material constants, rest unexplained • Test of model with Kieffer et al. 2000 estimate • “Back-of-the-envelope” calculation of thickness of silicate crust, then heat flux through it gives erosion rate after 200 minutes of 6.410-5 m/s • Previous page’s eqn gives 6.110-5 m/s, in very good agreement
Averaging over different ages • Equations analogous to spectral average • Assume new flow created at constant areal rate Ra • Assume flow started time ta ago, ended time tb ago • tb =0 for ongoing flow
Implications of SO2 and flow rate known • Milazzo et al. 2001 using I24 vs. I27 images measured RA=5m2/s of new dark flow over bright (SO2) areas • Substitution into previous equation gives tA ~ 1 day. • If flow continued for months, what else could cut off vaporization after one day? • Depth of SO2 snow field • 4 meters eroded after one day • Solidification then cooling of lava • 0.5 meters solid after one day – but cooling would continue vaporization • Energetics of cooling imply 0.2m lava depth will work • More complicated geometries • Lava burrows under SO2 (but should still vaporize snow above by radiation) • Other more complicated geometries?
Comparison of Powers from IR, Vaporization • 104 kg/s vaporization requires 5 GW • Observed infrared power 100-150 GW • Factor of 20-30 difference simply implies that only 1/20 or 1/30 of newly created lava flows interact with SO2. • The rest are presumably new lava flows on top of “dry” slightly older flows
Summary • Gas rate 104 kg/s confirmed (if geometry OK) • Adapted lava flow models show how SO2 rate depends upon material constants, areal rate, and time parameters • If 5 m2/s rate and 104 rate are right, something cuts off vaporization after 1 day • 4 meter depth of snow field? • 0.2 meter depth of lava? • More complicated geometry?