Download
1 / 20
200 likes | 510 Views
Observations and Modeling of Infrasound Produced by Ocean Waves. By Mark Willis Masters Student/Dept of Meteorology. Acknowledgements: Milton Garces (HIGP/ISLA), Claus Hetzer (ISLA), Steven Businger (UH Dept of Meteorology) and Paul Wittmann (FNMOC). Introduction to Infrasound.

E N D
Observations and Modeling of Infrasound Produced by Ocean Waves By Mark Willis Masters Student/Dept of Meteorology Acknowledgements: Milton Garces (HIGP/ISLA), Claus Hetzer (ISLA), Steven Businger (UH Dept of Meteorology) and Paul Wittmann (FNMOC)
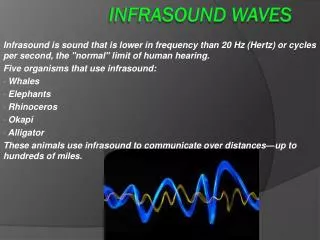
Introduction to Infrasound Surf Breaking 2-5 Hz Microbaroms 0.1-0.5 Hz Infrasound - low frequency sound waves below the 20 Hz hearing threshold of the human ear. Infrasonic waves can propagate thousands of kilometers due to low atmospheric absorption at low frequencies. Natural sources - severe weather, volcanoes, bolides, earthquakes, surf, mountain waves, open ocean wave-wave interactions.
Man-made sources of Infrasound also exist • Nuclear explosions, space debris entering the Earth’s atmosphere, and supersonic aircraft are a few examples of manmade infrasound sources (Bedard and Georges 2000). • Infrasound detectors were widely used in the early 1950’s during the Cold War to monitor the Globe for nuclear explosions. Satellite based nuclear detection systems diminished the need for infrasonic detectors in the 1960’s. • The Comprehensive Nuclear Test Ban Treaty (CTBT) was adopted by the United Nations General Assembly (Sept. 24, 1996) and now includes 170 countries. • CTBT prohibits nuclear testing of any kind.
Infrasound portion of the International Monitoring System * The International Monitoring System (IMS) was organized to ensure compliance of the CTBT * IMS provides global monitoring of nuclear testing in all of the Earth’s environments: underwater, underground, and in the atmosphere
Geophysical Infrasound Sources can Mask Nuclear Signals • At Oceanic Infrasound Stations, most of the background noise is related to a nearly continuous pressure oscillation occurring in the 0.1 to 0.5 Hz frequency range. • These signals are known as microbaroms and are believed to originate from open ocean wave-wave interactions. Microbarom range 1 kiloton nuclear explosion results in infrasound in the microbarom range.
History of Microbaroms • Microbaroms were first discovered by Benioff and Gutenberg (1939) on an electromagnetic microbarograph who concluded the signals were the result of offshore low pressure systems. • Further studies confirmed microbaroms originated from severe weather in the ocean (Saxer, 1954, Daniels, 1962, Donn and Posmentier, 1967, Rind, 1980). • These studies related microbarom arrivals to major surface weather patterns (esp. cold fronts and low pressure centers) and the associated high ocean surface waves. • Microbaroms were shown to have similar characteristics to their underground counterpart – microseisms - by Donn and Posmentier (1967), Donn and Naini (1973), Rind (1980).
Source Mechanism of Microbaroms and Microseisms • Longuet-Higgins (1950) described a microseism source involving the interaction of standing ocean waves with the sea floor. • Posmentier (1967) - When two ocean waves of opposite direction but nearly identical frequencies meet, the associated standing wave creates a nonlinear pressure perturbation that can travel at very high phase velocities. The corresponding acoustic wave will gain properties of the interfering wave trains (amplitude is proportional to ocean wave height, frequency = twice that of individual ocean waves). • Arendt and Fritts (2000) presented a microbarom source pressure formulation based on the Longuet-Higgins/Posmentier approaches. They found that frequency-doubling nonlinear interactions of pairs of ocean waves traveling in equal but opposite directions produces propagating acoustic waves of an isotropic nature.
Research Plan Garces (2003) developed an algorithm, based on the Arendt and Fritts model, to compute microbarom source pressure fields from ocean wave spectra provided by the NOAA Wavewatch III (WW3) model. WW3 outputs ocean wave energy densities in 24 directional and 25 frequency bands. For thesis research, I am using WW3 output to characterize microbarom generation regions and comparing to data received at our infrasound array located near Kona, Hawaii (IS59).
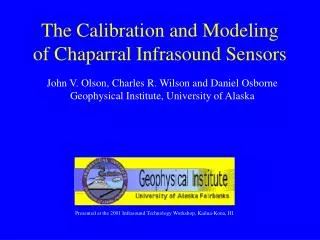
Data and Methods- Infrasound IS59 – Consists of 4 Chaparral 5 microphones. 3 are organized in a triangle with 1 in the center. Data recorded by 24-bit digitizers and sent in real time via radio telemetry to Infrasound Lab at Keahole Point. PMCC algorithm of Cansi et al. (1995) is used to detect coherent infrasonic energy across the array. This allows us to extract speed, arrival angle, and amplitude of detected arrivals.
Data and Methods– WW3 WW3 (Tolman, 1999) driven by NOGAPS 10m surface winds and global ice concentration values used to produce realistic wave spectra on a global 1 degree grid. WW3 outputs wave energy values (m2/Deg*Hz) in 24 directional and 25 frequency bins – this is used to calculated microbarom source fields.
Microbarom Observations NW S E * Microbarom Arrivals appear to show annual cycle associated with known weather patterns in the Pacific Basin.
Case Study: January 1-7, 2003 Microbarom Arrival Azimuth appears to correspond with low pressure location.
Case Study: Jan. 4, 2003 18Z Very active surface weather pattern, 7 low pressure centers evident in/near the Pacific including the intense cyclone just NNW of the Islands that created massive surf for exposed beaches on the 5th (>12m breakers observed)
WW3 Wave Spectra – Jan 4, 2003 18Z Wave spectra in region of benign surface pressure pattern Wave spectra upstream of ~950 mb storm location
Preliminary Source Modeling Results (Jan. 4, 18Z 2003 Case) Log Base 10 of Acoustic Source Pressure (Pa * m3) Acoustic Source Pressure for 0.197 Hz shown, corresponds to ocean waves of ~ 10s interacting Peaks in wake regions of low pressure centers, also several scattered peaks throughout the Pacific
Summary - Observations • Yearly microbarom arrivals show an annual cycle. • During boreal summer, arrivals concentrated from E and S directions. East arrivals expected to originate in the wake of tropical cyclones in the EPAC or from island reflection of trade wind swells. South arrivals likely originate in the wake of mid-lat storms in the SPAC. • During boreal winter, arrivals concentrated from W, NW, N directions. These arrivals likely originate in the wake of surface lows in NPAC mid-lat and from WPAC Tropical Cyclones. • Atmospheric conditions and attenuation of microbarom signal along propagation path have large effect on arrivals.
Summary – Microbarom Source Modeling • Past research related microbaroms to low pressure centers, cold fronts, and associated regions of high significant wave heights. • Our source modeling results show that microbaroms are generated in regions where wave trains are moving in opposite directions with similar frequencies, such as in the wake regions of low pressure centers. • However, interfering wave trains may occur at a substantial distance from the wave producing winds, and thus microbarom production can be widespread. ~ The End