Download
1 / 60
600 likes | 709 Views
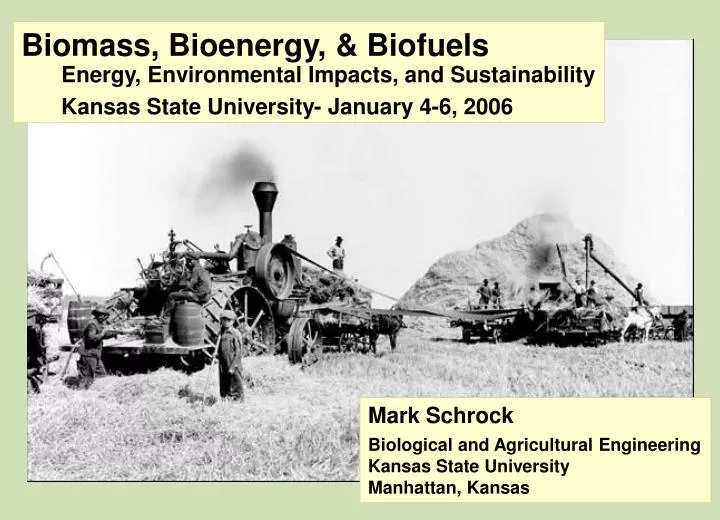
Biomass, Bioenergy, & Biofuels Energy, Environmental Impacts, and Sustainability Kansas State University- January 4-6, 2006. Mark Schrock Biological and Agricultural Engineering Kansas State University Manhattan, Kansas. Petroleum Consumption Trends. Source: BP, 2002. Approximate 2005.

E N D
Biomass, Bioenergy, & Biofuels • Energy, Environmental Impacts, and Sustainability • Kansas State University- January 4-6, 2006 Mark Schrock Biological and Agricultural Engineering Kansas State University Manhattan, Kansas
Petroleum Consumption Trends Source: BP, 2002
“Global production of conventional oil will begin to decline sooner than most people think, probably within 10 years”C.J. Campbell and J.H. Laherrere Scientific American—March 1998 No One Really Knows... “There’s plenty of cheap oil, says the US Geological Survey” Eric NiilerScientific American—September 2000
Comparing the Energy Market to Agriculture US Vehicle Fuel Consumption, 1999 Billion Gallons Gasoline 123 Diesel Fuel 33 Source: DOE
Agriculture’s Energy Potential: US Gasoline Consumption ~123 Billion Gallon Conclusion: Energy is a MUCH larger market than food.
Relative Food and Energy Prices 1973: 1 Bushel bought 1 Barrel 2005: ~17 Bushels bought 1 Barrel 2005: 1 Bushel of Wheat bought 1 GALLON of Diesel fuel.
Will Energy Put a Floor Under Grain Prices? Crude Oil Price / Wheat Price Equal Energy Basis Crossover 2004? Assumed LHV: Wheat @ 7,500 BTU/lb Crude @ 19,000 BTU/lb (On an energy basis, Grain Sorghum is currently less than half the price of crude oil.)
The Successor to Petroleum for Transportation has NOT been Identified BioFuels (ETOH, Biodiesel, Methane) PV or Wind>>Hydrogen>>Fuel Cell? PV or Wind>>Batteries? Coal-Derived Liquids>>IC Engine or Fuel Cell? ALL Major Auto Makers (and DOE, USDA, etc) Have Active R & D…
Hydrogen • Issues: • Supply/Cost • Storage • Range • Safety MDS Prediction: This WON’T be cheap.
Moving Transportation Beyond Petroleum Conserve Change Transportation Mode Mix Transition to Renewables
Current 1949 1964 1973 2005: Class 8 Trucks Burn ~ ½ of US Diesel fuel
Comparing Transportation Modes • Current Fuel: • Diesel • Electricity • Coal • Wood • Future Fuel: • Above, plus • Fuel Cells? 1 Degree of Freedom (always on track) + Steel On Steel (Low Crr, Weight Tolerant) = Wide Fuel Flexibility Our most omnivorous mode of transportation
Fast Passenger Rail (French TGV, Japanese Bullet Train) • First TGV powered by Gas Turbine (ca. 1972) • Changed to Electrical Power in Response to Arab Oil Embargo, 1974 • In Regular Service since 1981 ~ 80% of France’s Electricity is Nuclear
Container Freight • Multi-Mode • Ship • Train • Truck
Comparing Transportation Modes • Current Fuel: • Gasoline (SI) • Diesel (CI) • Future Fuel: • Liquids • Fuel Cell? • Battery? 2 Degrees of Freedom Moderate Weight Sensitivity
Comparing Transportation Modes • Current Fuel: • AvGas (SI) • Jet A, JP-4 (Turbines) • Future Fuel: • Liquids • (Incl. Biodiesel) • Alternatives (Fuel Cell, etc) are tenuous! Three Degrees of Freedom Very High Weight Sensitivity Very Demanding Fuel Requirements
Aircraft Weight Sensitivity Example: Boeing 747- 400 from Tokyo—New York Take-Off Weight = 375 Tons Landing Weight = 250 Tons Fuel Burn = 125 Tons Fuel Reserve = 25 Tons Fuel > 1/3 of Take-Off Weight Source: Boeing
Forms of Photosynthesis Green Plants C4 Purple Bacteria Cyanobacteria C3
Efficiency of Photosynthesis Sunlight to Sugar 11% is Absolute Top Theoretical Efficiency Losses are Estimated at: Evolutionary Survival 20-25% Respiration (Structure, etc) 20-100% So New Practical Peak = ~5% Source: Smil
Efficiency of Photosynthesis Crassulacean Acid Metabolism Separates (in time) energy absorption And carbon fixation Most Common Limit to Photosynthesis is WATER Lowest Transpiration Loss: 400-500 moles H2O per mole CO2 Fixed Source: Smil
Comparing Photosynthetic Pathways C3 C4 Saturation of Radiation, W/m2 300 None Best Temperature, oC 15-25 30-45 Moles H2O per mole CO2 Fixed: 900-1200 400-500 Maximum Daily Growth: g/m2 34-39 50-54 Daily Max, Average for Season: g/m2 13 22 Source: Smil
Example: Photosynthetic Efficiency of Corn Given: Average Radiation = 210 W/m2 Grain Yield = 200 bu/acre Grain Energy = 17 MJ/kg Growing Season = 150 days Total Season Radiation: 210 W/m2 * 3600 * 24 * 150 = 2.72 * 109 J/ m2 Grain Energy: 200 * 56 * 17 * 2.47/2.2 = 2.1 * 105 MJ/ha Photosynthetic Efficiency (Grain Only): 2.1 * 105 MJ/ha / 2.72 * 109 J/ m2 = 0.77%
Example: Photosynthetic Efficiency of Corn If Stover is Harvested, and MOG/Grain = 1: Photosynthetic Eff Would ~Double To ~ 1.5%
Solar Conversion Efficiency C3 Crops 0.1-0.7% Best C4 (Sugar Cane) 1.5-2.5% Global Mean ~0.3% Kansas Farmland (0.5%) $500-4000/ac PV Array (12%) $2,000,000/ac Source: Smil
BioEnergy Issues: Does it Really Produce Energy? Energy Profit Ratio = Energy Out / Energy In
Energy Profit RatioUS Domestic Petroleum Production vs Mining…
Production Direct Field Operations Irrigation Grain Drying Management Embodied Fertilizer Seed Chemicals Machinery Agricultural Energy Inputs:
Energy Outputs: Fuel • ETOH • BioDiesel • Others CoProduct • DDGS • Gluten Feed • Seed Meal • Pesticides • Others The CoProduct may have more value (both $ and BTU) than the fuel.
Energy Inputs for Corn Production: Total Inputs = 49,753 btu / bu 17,000 btu/bu 27,000 btu/bu Source: Shapouri, Duffield, & Wang, 2004
Energy Balance for Ethanol Production: Source: Shapouri, Duffield, & Wang, 2004
Opportunities for Improving Ethanol’s Energy Balance: Corn Fertilization, especially Nitrogen Ethanol Processing (Cogen)
Biodiesel Energy Profit Ratio: Biodiesel Feedstocks: wide variety of plant oil and animal fats. The most comprehensive analysis (Sheehan, et al, 1998) considered Soybean oil (>300 page report). Conclusion: Soy Biodiesel EPR = 3.21. Other feedstocks (esp. non-legumes) will have lower/higher EPR.
Fossil Inputs to Soy Biodiesel: MJ Fossil/MJ Biodiesel Soybean Agriculture 0.0656 Soybean Transport 0.0034 Soybean Crushing 0.0796 Soy Oil Transport 0.0072 Soy Oil Esterif. (incl. MEOH) 0.1508 Biodiesel Transport 0.0044 Total 0.3110 Source: Sheehan, et al., 1998
Other Biodiesel EPRs: Energy Out/Energy In Corn Oil, Illinois 3.95 Cotton Seed Oil, Texas 1.76 Crambe, Kentucky 3.11 Peanut, Georgia 2.26 Spring Rape, Canada 4.18 Safflower, California 3.39 Soybeans, Illinois 4.56 Sunflowers, North Dakota 3.5 All Crops Dryland Production Source: Goering & Daugherty, 1982
Basic Esterification: Low PressuresLow Temperatures
Esterification Reduces Viscosity Source: Clark, et al., 1984 (KSU)
Biodiesel Properties: Unit Diesel MESO Specific Gravity kg/L 0.82-.85 0.86-.90 Viscosity Cst 2-3 3.5-5 Lower Heating Value MJ/kg 42-43 40 Cetane Number 45-49 48 Flash Point C 74 >100 Source: Clark, et al., 1984 (KSU)
Power From Soy Esters Source: Clark, et al., 1984 (KSU)
Desirable Traits for Energy Crops Legume (or low protein product) Perennial (low energy inputs) Low Processing Energy Good Yields on Dryland Two Paths: Adapt food crops to energy production Domesticate new energy crops
Soybean Glycine max Temperate Legume Annual Cultivated for 3000 yrs Seed Yield 3.1 Mg/ha Oil Content 17-26% Oil Yield 650 kg/ha Ref: CIGR V. Seed Yield 2 Mg/ha (30 bu/ac) Oil Content 18% Oil Yield 360 kg/ha (46 gal/ac)
Sunflower Helianthus annus Temperate Annual Seed Yield 3.7 Mg/ha Oil Content 35-40% Oil Yield 1400 kg/ha Ref: CIGR V. Seed Yield 1.7(dry)-3.4 (irr) Mg/ha Oil Content 40% Oil Yield 700-1400 kg/ha (90-180 gal/ac) Ref: KSU Hybrid Trials
Peanut Arachis hypogaea Temperate Annual Legume Seed Yield 5 Mg/ha Oil Content 36-50% Oil Yield 2000 kg/ha Ref: CIGR V. Seed Yield 2.5 Mg/ha (irr) Oil Content 48% Oil Yield 1200 kg/ha (150 gal/ac) Ref: KSU (ASAE MCR85-142)
Castor Ricinus communis Temperate Perennial Grown as Annual Ricin (potent toxin) Seed Yield 5 Mg/ha Oil Content 35-55% Oil Yield 2250 kg/ha (285 gal/ac) Ref: CIGR V. Lubricant “Castrol” Grown in SW KS & TX panhandle, WWII era.
Rape Canola (low erucic Rape) Brassica napus Idaho Biofuels Program Temperate Annual Pacific NW, Canada, China Seed Yield 3 Mg/ha Oil Content 33-40% Oil Yield 1100 kg/ha (140 gal/ac) Ref: CIGR V.
Safflower Carthamus tinctorius Temperate Annual Pacific NW Seed Yield 4.5 Mg/ha Oil Content 25-37% Oil Yield 1300 kg/ha Ref: CIGR V.
Crambe Crambe abyssinica Temperate Annual German-French Tests (dry): Seed Yield 5 Mg/ha Oil Content 36% Oil Yield 1800 kg/ha (225 gal/ac) “dt” = 100 kg Ref: CIGR V.
Plant-Derived Liquid Fuels Four Options
Expanding Land Available for Energy: Perennial vs. Annual Agriculture • Factors that Render • Land Non-Arable: • Steep Slopes • Shallow Topsoil • Sandy Topsoil • Surplus or Deficient Water • Variable Climate • Rocks Perennial Agriculture SHOULD BE far less vulnerable.
Class IV Land: Marginally Arable Sandy Topsoil (High Erosion & Low Water Capacity) Perennial Windbreak Temporary Windbreak (reduces wind erosion) Winter Wheat (intended crop) Water Table < 5 m. Deep