Download
1 / 5
50 likes | 218 Views
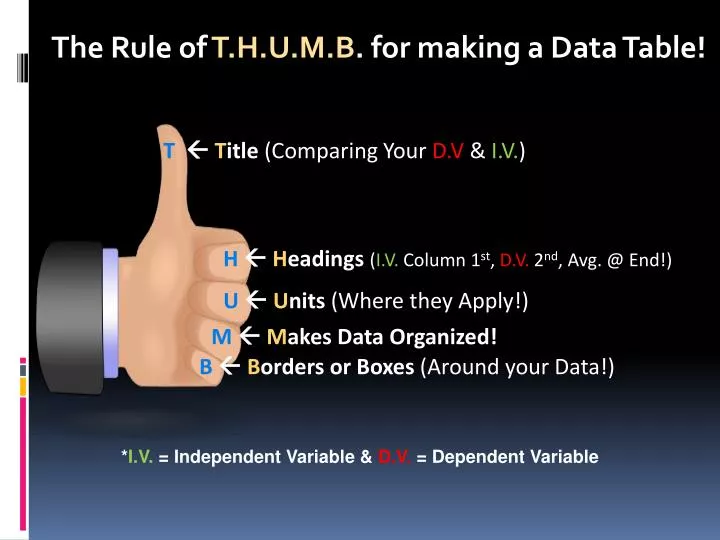
The Rule of T.H.U.M.B . for making a Data Table!. T T itle (Comparing Your D.V & I.V. ). H H eadings ( I.V. Column 1 st , D.V. 2 nd , Avg. @ End!). U U nits (Where they Apply!). M M akes Data Organized!. B B orders or Boxes (Around your Data!).

E N D
The Rule of T.H.U.M.B. for making a Data Table! TTitle (Comparing Your D.V & I.V.) HHeadings (I.V. Column 1st, D.V. 2nd, Avg. @ End!) UUnits (Where they Apply!) MMakes Data Organized! BBorders or Boxes (Around your Data!) *I.V. = Independent Variable & D.V. = Dependent Variable
Example 1: “Title – Comparing D.V. to I.V.” * If I wanted to see how fertilizer affected the growth of a plant and I gathered the following data: A plant was given no fertilizer and grew 5 cm, Another was given 1 gram of fertilizer and grew 7 cm, and the last was given 2 grams of fertilizer and grew 10 cm. I could then organize that data accordingly into a table! Title= Plant Growth (cm) vs. The Amount of Fertilizer Received
Example 2:“Title – Comparing D.V. to I.V.” * An experiment tested three different insects (spider, ant & beetle) to see which one ran a certain distance (3 meters) the quickest. Each insect was given 3 chances (trials); here was the data collected: Spider Trial 1 = 12 seconds, T 2 = 11 sec, and T 3 = 10 sec. Ant Trial 1 = 22 sec, T2 = 23 sec, and T 3 = 21 sec. The Beetle T1 = 7 sec, T2 = 6 sec, T3 = 5 sec. Organize the Data in a Table according to T.H.U.M.B. ! Title = Time in Seconds vs. Different Insects
YOUR TURN: I collected the following data: Student 1 received an 80% on their Biology test, Student 2 = 85% , Student 3 = 75% and Student 4 = 98%. *Create your table using THUMB below: Biology Test Percentage vs. Students Tested
A little Tougher Now: 4 kids (2 boys and 2 girls), were tested to see how long it took to clean their rooms each day for 3 consecutive days; the data is as follows: Shelly took 1 hour on day 1, 45 minutes on day 2 and 1 hour 10 minutes on day 3. Tom took 45 minutes on day 1, 2 hours on day 2 and 1 hour 30 minutes on day 3. Rich took 2 hours on day 1, 3 hours on day 2 and 2 hours on day 3. Jenny took 30 minutes on day 1, 35 minutes on day 2, and 40 minutes on day 3. Averages time take to clean the room was: Shelly = *Create your table using THUMB below: Time it Took to Clean Their Room Each Day vs Kids