Download
1 / 1
10 likes | 100 Views
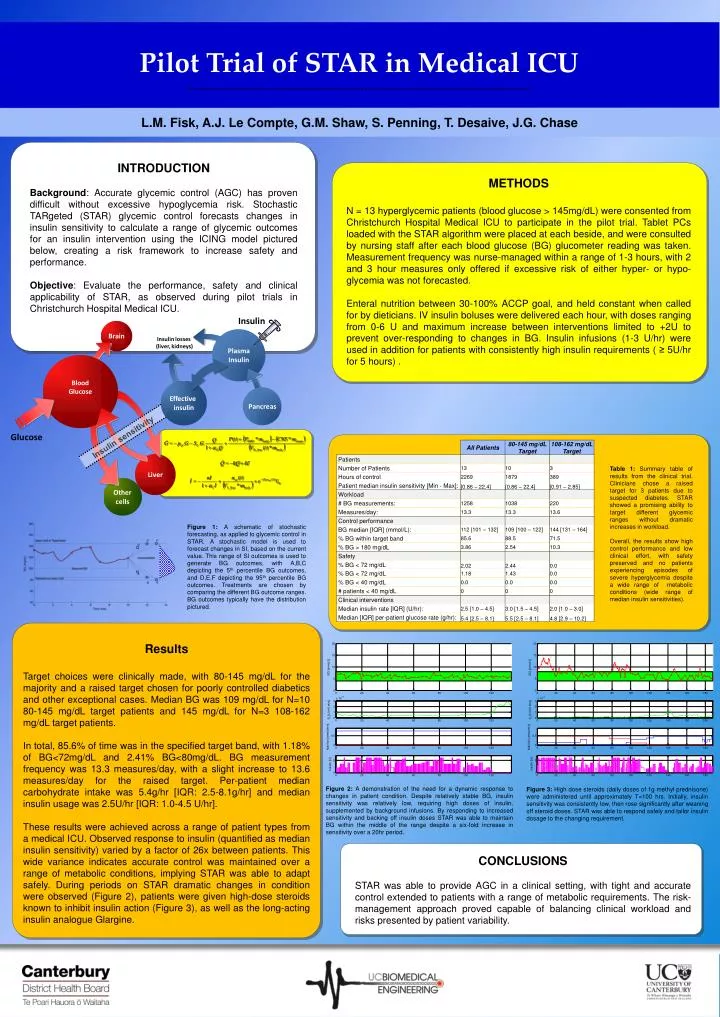
Pilot Trial of STAR in Medical ICU.

E N D
Pilot Trial of STAR in Medical ICU Figure 2: Controller forecast schematic for BG a target range of 80 – 145mg/dL. A BG measurement has been taken at 10hrs, and forecasts of BG have been generated (points A-F). The depicted distribution indicates the skewed nature of BG forecasts within the 5th-95th percentiles. L.M. Fisk, A.J. Le Compte, G.M. Shaw, S. Penning, T. Desaive, J.G. Chase INTRODUCTION Background: Accurate glycemic control (AGC) has proven difficult without excessive hypoglycemia risk. Stochastic TARgeted (STAR) glycemic control forecasts changes in insulin sensitivity to calculate a range of glycemic outcomes for an insulin intervention using the ICING model pictured below, creating a risk framework to increase safety and performance. Objective: Evaluate the performance, safety and clinical applicability of STAR, as observed during pilot trials in Christchurch Hospital Medical ICU. METHODS N = 13 hyperglycemic patients (blood glucose > 145mg/dL) were consented from Christchurch Hospital Medical ICU to participate in the pilot trial. Tablet PCs loaded with the STAR algorithm were placed at each beside, and were consulted by nursing staff after each blood glucose (BG) glucometer reading was taken. Measurement frequency was nurse-managed within a range of 1-3 hours, with 2 and 3 hour measures only offered if excessive risk of either hyper- or hypo- glycemia was not forecasted. Enteral nutrition between 30-100% ACCP goal, and held constant when called for by dieticians. IV insulin boluses were delivered each hour, with doses ranging from 0-6 U and maximum increase between interventions limited to +2U to prevent over-responding to changes in BG. Insulin infusions (1-3 U/hr) were used in addition for patients with consistently high insulin requirements ( ≥ 5U/hr for 5 hours) . Table 1: Summary table of results from the clinical trial. Clinicians chose a raised target for 3 patients due to suspected diabetes. STAR showed a promising ability to target different glycemic ranges without dramatic increases in workload. Overall, the results show high control performance and low clinical effort, with safety preserved and no patients experiencing episodes of severe hyperglycemia despite a wide range of metabolic conditions (wide range of median insulin sensitivities). Figure 1: A schematic of stochastic forecasting, as applied to glycemic control in STAR. A stochastic model is used to forecast changes in SI, based on the current value. This range of SI outcomes is used to generate BG outcomes, with A,B,C depicting the 5th percentile BG outcomes, and D,E,F depicting the 95th percentile BG outcomes. Treatments are chosen by comparing the different BG outcome ranges. BG outcomes typically have the distribution pictured. Results Target choices were clinically made, with 80-145 mg/dL for the majority and a raised target chosen for poorly controlled diabetics and other exceptional cases. Median BG was 109 mg/dL for N=10 80-145 mg/dL target patients and 145 mg/dL for N=3 108-162 mg/dL target patients. In total, 85.6% of time was in the specified target band, with 1.18% of BG<72mg/dL and 2.41% BG<80mg/dL. BG measurement frequency was 13.3 measures/day, with a slight increase to 13.6 measures/day for the raised target. Per-patient median carbohydrate intake was 5.4g/hr [IQR: 2.5-8.1g/hr] and median insulin usage was 2.5U/hr [IQR: 1.0-4.5 U/hr]. These results were achieved across a range of patient types from a medical ICU. Observed response to insulin (quantified as median insulin sensitivity) varied by a factor of 26x between patients. This wide variance indicates accurate control was maintained over a range of metabolic conditions, implying STAR was able to adapt safely. During periods on STAR dramatic changes in condition were observed (Figure 2), patients were given high-dose steroids known to inhibit insulin action (Figure 3), as well as the long-acting insulin analogue Glargine. Figure 2: A demonstration of the need for a dynamic response to changes in patient condition. Despite relatively stable BG, insulin sensitivity was relatively low, requiring high doses of insulin, supplemented by background infusions. By responding to increased sensitivity and backing off insulin doses STAR was able to maintain BG within the middle of the range despite a six-fold increase in sensitivity over a 20hr period. Figure 3: High dose steroids (daily doses of 1g methyl prednisone) were administered until approximately T=100 hrs. Initially, insulin sensitivity was consistently low, then rose significantly after weaning off steroid doses. STAR was able to respond safely and tailor insulin dosage to the changing requirement. CONCLUSIONS STAR was able to provide AGC in a clinical setting, with tight and accurate control extended to patients with a range of metabolic requirements. The risk-management approach proved capable of balancing clinical workload and risks presented by patient variability.