Download

1 / 26
260 likes | 269 Views
CS 201 The Memory Heirarchy. Gerson Robboy Portland State University. Random-Access Memory (RAM). Key features RAM is packaged as a chip. Basic storage unit is a cell (one bit per cell). Multiple RAM chips form a memory. Static RAM ( SRAM )

E N D
CS 201The Memory Heirarchy Gerson Robboy Portland State University
Random-Access Memory (RAM) • Key features • RAM is packaged as a chip. • Basic storage unit is a cell (one bit per cell). • Multiple RAM chips form a memory. • Static RAM (SRAM) • Each cell stores bit with a six-transistor circuit. • Retains value indefinitely, as long as it is kept powered. • Relatively insensitive to disturbances such as electrical noise. • Faster and more expensive than DRAM. • Dynamic RAM (DRAM) • Each cell stores bit with a capacitor and transistor. • Value must be refreshed every 10-100 ms. • Sensitive to disturbances. • Slower and cheaper than SRAM.
SRAM vs DRAM Summary Tran. Access per bit time Persist? Sensitive? Cost Applications SRAM 6 1X Yes No 100x cache memories DRAM 1 10X No Yes 1X Main memories, frame buffers
Typical Bus Structure Connecting CPU and Memory • A bus is a collection of parallel wires that carry address, data, and control signals. • Buses are typically shared by multiple devices. CPU chip register file ALU system bus memory bus main memory bus interface I/O bridge
Disk Geometry • Disks consist of platters, each with two surfaces. • Each surface consists of concentric rings called tracks. • Each track consists of sectors separated by gaps. tracks surface track k gaps spindle sectors
Disk Geometry (Muliple-Platter View) • Aligned tracks form a cylinder. cylinder k surface 0 platter 0 surface 1 surface 2 platter 1 surface 3 surface 4 platter 2 surface 5 spindle
Disk Capacity • Capacity: maximum number of bits that can be stored. • Vendors express capacity in units of gigabytes (GB), where 1 GB = 10^9. • Capacity is determined by these technology factors: • Recording density (bits/in): number of bits that can be squeezed into a 1 inch segment of a track. • Track density (tracks/in): number of tracks that can be squeezed into a 1 inch radial segment. • Areal density (bits/in2): product of recording and track density. • Modern disks partition tracks into disjoint subsets called recording zones • Each track in a zone has the same number of sectors, determined by the circumference of innermost track. • Each zone has a different number of sectors/track
Exercise: Computing Disk Capacity • What is the capacity of a disk with: • 512 bytes/sector • 300 sectors/track (on average) • 20,000 cylinders • 5 platters
The read/write head is attached to the end of the arm and flies over the disk surface on a thin cushion of air. By moving radially, the arm can position the read/write head over any track. Disk Operation (Single-Platter View) The disk surface spins at a fixed rotational rate spindle spindle spindle spindle spindle
Disk Operation (Multi-Platter View) read/write heads move in unison from cylinder to cylinder arm spindle
Disk Access Time • Average time to access some target sector approximated by : • Taccess = Tavg seek + Tavg rotation + Tavg transfer • Seek time (Tavg seek) • Time to position heads over cylinder containing target sector. • Typical Tavg seek = 9 ms • Rotational latency (Tavg rotation) • Time waiting for first bit of target sector to pass under r/w head. • Tavg rotation = 1/2 x 1/RPMs x 60 sec/1 min • Transfer time (Tavg transfer) • Time to read the bits in the target sector. • Tavg transfer = 1/RPM x 1/(avg # sectors/track) x 60 secs/1 min.
Disk Access Time Example • Given: • Rotational rate = 7,200 RPM • Average seek time = 9 ms. • Avg # sectors/track = 400. • Derived: • Tavg rotation = 1/2 x (60 secs/7200 RPM) x 1000 ms/sec = 4 ms. • Tavg transfer = 60/7200 RPM x 1/400 secs/track x 1000 ms/sec = 0.02 ms • Taccess = 9 ms + 4 ms + 0.02 ms • Important points: • Access time dominated by seek time and rotational latency. • First bit in a sector is the most expensive, the rest are free. • SRAM access time is about 4 ns/doubleword, DRAM about 60 ns • Disk is about 40,000 times slower than SRAM, • 2,500 times slower then DRAM.
Logical Disk Blocks • Modern disks present a simpler abstract view of the complex sector geometry: • The set of available sectors is modeled as a sequence of b-sized logical blocks (0, 1, 2, ...) • Mapping between logical blocks and actual (physical) sectors • Maintained by hardware/firmware device called disk controller. • Converts requests for logical blocks into (surface,track,sector) triples. • Allows controller to set aside spare cylinders for each zone. • Accounts for the difference in “formatted capacity” and “maximum capacity”.
I/O Bus CPU chip register file ALU system bus memory bus main memory bus interface I/O bridge I/O bus Expansion slots for other devices such as network adapters. USB controller graphics adapter disk controller mouse keyboard monitor disk
Storage Trends metric 1980 1985 1990 1995 2000 2000:1980 $/MB 19,200 2,900 320 256 100 190 access (ns) 300 150 35 15 2 100 SRAM metric 1980 1985 1990 1995 2000 2000:1980 $/MB 8,000 880 100 30 1 8,000 access (ns) 375 200 100 70 60 6 typical size(MB) 0.064 0.256 4 16 64 1,000 DRAM metric 1980 1985 1990 1995 2000 2000:1980 $/MB 500 100 8 0.30 0.05 10,000 access (ms) 87 75 28 10 8 11 typical size(MB) 1 10 160 1,000 9,000 9,000 Disk Why can’t the access time of a disk be reduced a lot more?
CPU Clock Rates 1980 1985 1990 1995 2000 2003 2003:1980 CPU 8080 286 386 Pent P-III P-IV MHz 1 6 20 150 750 2000 2000 ns/cycle 1,000 166 50 6 1.6 0.5 2000 • Summary: In 25 years - • DRAM Memory has gotten 10,000 times bigger and cheaper, and only around 6 times faster • Disks have gotten 10,000 times bigger and cheaper and around 10 times faster • CPUs have gotten 2000 to 3000 times faster • Disks and memory are orders of magnitude slower in comparison
The CPU-Memory Gap • The increasing gap between DRAM, disk, and CPU speeds.
Another way of looking at it • 1980: • DRAM access = 375 ns. = ~ 0.4 CPU cycles • Disk access = ~100 msec = ~1000 CPU cycles • Now • DRAM access = 60 ns. = ~ 120 CPU cycles • Disk access = ~10 msec = ~20,000,000 CPU cycles • This suggests we’d like to use SRAM, if only it weren’t 100 times as expensive as DRAM.
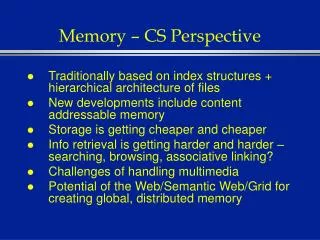
Memory Hierarchies • Some fundamental and enduring properties of hardware and software: • Fast storage technologies cost more per byte and have less capacity. • The gap between CPU and main memory speed is widening. • Well-written programs tend to exhibit good locality. • These fundamental properties complement each other. • They suggest an approach for organizing memory and storage systems known as a memory hierarchy.
L1 cache holds cache lines retrieved from the L2 cache memory. L2 cache holds cache lines retrieved from main memory. Main memory holds disk blocks retrieved from local disks. Local disks hold files retrieved from disks on remote network servers. An Example Memory Hierarchy Smaller, faster, and costlier (per byte) storage devices L0: registers CPU registers hold words retrieved from L1 cache. on-chip L1 cache (SRAM) L1: off-chip L2 cache (SRAM) L2: main memory (DRAM) L3: Larger, slower, and cheaper (per byte) storage devices local secondary storage (local disks) L4: remote secondary storage (distributed file systems, Web servers) L5:
Caches • Cache: A smaller, faster storage device that contains a subset of the data in a larger, slower device. • Fundamental idea of a memory hierarchy: • For each k, the faster, smaller device at level k serves as a cache for the larger, slower device at level k+1. • Why do memory hierarchies work? • Programs tend to access the data at level k more often than they access the data at level k+1. • Thus, the storage at level k+1 can be slower, and thus larger and cheaper per bit. • Goal: A large pool of memory that costs as much as the cheap storage near the bottom, but that serves data to programs at the rate of the fast storage near the top.
Cache Type What Cached Where Cached Latency (cycles) Managed By Registers 4-byte word CPU registers 0 Compiler TLB Address translations On-Chip TLB 0 Hardware L1 cache 32-byte block On-Chip L1 1 Hardware L2 cache 32-byte block Off-Chip L2 10 Hardware Virtual Memory 4-KB page Main memory 100 Hardware+OS Buffer cache Parts of files Main memory 100 OS Network buffer cache Parts of files Local disk 10,000,000 AFS/NFS client Browser cache Web pages Local disk 10,000,000 Web browser Web cache Web pages Remote server disks 1,000,000,000 Web proxy server Examples of Caching in the Hierarchy
Intel Pentium Cache Hierarchy Processor Chip L1 Data 1 cycle latency 16 KB 4-way assoc Write-through 32B lines L2 Unified 128KB--2 MB 4-way assoc Write-back Write allocate 32B lines Main Memory Up to 4GB Regs. L1 Instruction 16 KB, 4-way 32B lines
More recent info for Pentium-4 • L1 data cache • 8K bytes, on the cpu • 2 cycle latency • L1 instruction cache replaced with “execution trace cache” • Optimized for fetching and decoding instructions • L2 cache (unified? data only?) • 256K - 1 MB, also on the cpu • 8-way set associative, 64-byte cache line size • 18 cycle latency, even though it’s on the CPU • 2 MB L3 cache off chip • Memory has around 92 cycle latency
The memory cache • Stores values from main memory, recently accessed by the processor. • Controlled by the hardware – completely invisible to software • except for the performance
Cache Performance Metrics • Miss Rate • Fraction of memory references not found in cache (misses/references) • Typical numbers: • 3-10% for L1 • can be quite small ( < 1%) for L2, depending on size, etc. • Hit Time • Time to deliver a line in the cache to the processor (includes time to determine whether the line is in the cache) • Typical numbers: • 2 clock cycles for L1 • ~20 clock cycles for L2 • Miss Penalty • Additional time required because of a miss • Typically ~100 cycles for main memory