Download
1 / 6
60 likes | 159 Views
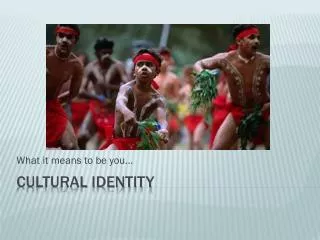
The cultural and ethnic identity of children, young people in Norfolk today. Nigel Nicholds Planning, Performance and Partnerships Service. Testing your Norfolk knowledge. How many children and young people are there living in Norfolk (under 18)?

E N D
The cultural and ethnic identity of children, young people in Norfolk today Nigel Nicholds Planning, Performance and Partnerships Service
Testing your Norfolk knowledge How many children and young people are there living in Norfolk (under 18)? After English, what is the next most common preferred language in Norfolk schools? Answers will all be revealed after the quiz….
Answers How many children and young people are there living in Norfolk (under 18)? 163,000(ONS mid-year estimate = 163,159) After English, what is the next most common preferred language in Norfolk schools? Portuguese (then Polish)
Proportion of children from a BAME background Proportion of children with a disability Proportion of children in need with a disability Proportion of children with a statement of special educational need Proportion of children who are lesbian, gay, bisexual or transgender About 5.3% (school population January 2012) Estimated 2.5-3%(therefore about 4,500) About 13%(using DDA definition) About 3% Estimated at 6% - 9% Answers
Proportion of children who are looked after Proportion of looked after children from a BAME background Proportion of looked after children from a BAME background in Suffolk Proportion of children with a child protection plan Proportion of children with a child protection plan who are from a BAME background Proportion of children who are a “child in need” on any given day About 0.62% About 8% About 16% About 0.34% About 3.5% About 3%
Some useful sources of further information • www.norfolkinsight.org.uk • www.chimat.org.uk • www.whereilive.norfolk.gov.uk