Download
1 / 21
220 likes | 416 Views
RFM Analysis Extension. Group F Sara Cisneros Wanda Di Maggio Gregory Gonzales Cinthia Rojas. Part A. As a team, explain how RFM analysis works. Also explain how RFM analysis described in the Innovation in Practice box on page 351 works. RFM Analysis.

E N D
RFM Analysis Extension Group F Sara Cisneros Wanda Di Maggio Gregory Gonzales Cinthia Rojas
Part A • As a team, explain how RFM analysis works. Also explain how RFM analysis described in the Innovation in Practice box on page 351 works.
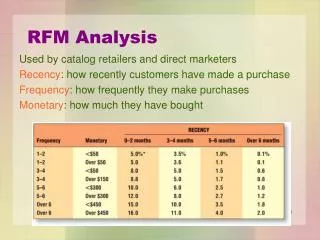
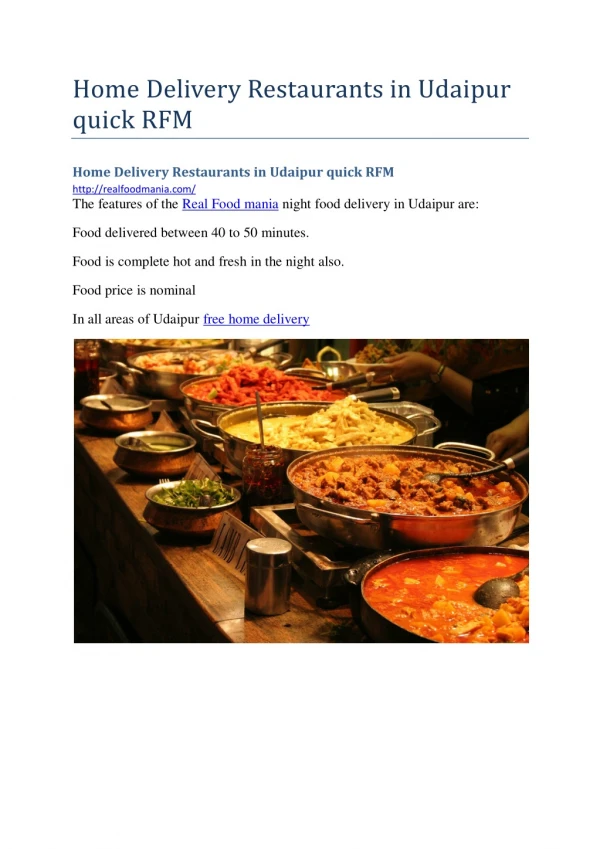
RFM Analysis RFM is a method used for analyzing customerbehavior and defining market segments. It is commonly used in database marketingand direct marketing and has received particular attention in retail. • RFM stands for • Recently • Frequently • Monetary Value
RFMP Analysis • P Criterion, means how fast the customer pay. • Also, the company compute the value D, means the number of days that expire between the issuing of an invoice and the arrival of the payment.
Part B • As a team, evaluate the effectiveness of RFM analysis. What seem to be chief strengths of this technique? Under what conditions would its results be misleading? Describe, in general terms, when you would not.
Strengths of RFM technique • Easy to Implement • Identify ideal customers for marketing
What conditions would RFM results be misleading? RFM analysis is not a statistical modeling technique, it is not forward-looking. It fails to predict the probability of a customer to respond to various marketing stimuli.
When we would use the RFM and when we would not? • RFM analysis often being used to identify customers to whom marketing should be targeted, RFM analyses fail to provide insight into who is truly likely to respond to marketing. • RFM analysis cannot be used to predict changes in customer behavior over time, which is particularly relevant during periods of recession.
Part C • As a team, evaluate the effectiveness of RFMP analysis. What action should you take with a [1, 1,1,5] customer? What action should you take with a [3, 3, 3, 1] customer? What about a [5, 5, 5, 1] customer? Under what circumstances, if any, is RFMP preferred over RFM?
RFMP analysis • Customer 1 has ordered recently, orders frequently, and its orders were of the highest monetary value. P score of 5 indicates, however, that it does not pays quickly. From these scores, we can conclude that customer 1 is a good customer, but it have to pay more quickly. The accounting’s department should contact it immediately.
Customer 2 is right in the middle with 3,3,3 score. Its P score is 1, that means it pays quickly. Customer 2 is a ok customer, and it is not necessary that no one in sales spend much time with it. • Customer 3 has not ordered for some time, did not order frequently; and when it did order, it bought the least expensive items, and not many of them. But this customer pays quickly. We think no one on the sales team should even think about this customer. We should let customer 3 go to the competition because the loss will be minimal.
Part D • Devise a version of the RFM analysis to rank suppliers. What criteria would you use to rank them? Explain how you would use the supplier-ranking score produce by your analysis.
RFM analysis to rank suppliers The RFM reporting tool first sorts suppliers delivery order records by the date of their most recent delivery. In a common form of this analysis, the tool then divides the suppliers into five groups and gives the suppliers in each group a score of 1 to 5. The 20 percent of the suppliers having the most recent delivery order are giving an R score of 1, the 20 percent of the suppliers having the next most recent delivery are giving an R score of 2, and so forth, down to the last 20 percent, who are given an R score of 5. The suppliers on the basis of how frequently they make a delivery. The 20 percent of the suppliers who make deliveries must frequently are giving an F score of 1, the next 20 percent of most frequently deliveries suppliers are given a score of 2, and so forth. down to the least frequently suppliers deliveries, who are giving an F score of 5.
Finally, the tool sorts the customers again according to the amount spent on their suppliers deliveries. The 20 percent who have suppliers the most expensive delivery are given an M score of 1, the next 20 percent are given an M score of 2, and so forth, down to the 20 percent who spend the least delivers, who are given an M score of 5.
Part E • Devise a version of the RFM analysis to rank sales people. What criteria would you use to rank them? Explain how you would use the salesperson ranking score produce by your analysis.
RFM analysis to rank Sales-people • The RFM reporting criteria first sorts sales-people records by the date of their most recent (R) sale. The 20 percent of the sales-people having the most recent sales are given an R score of 1, the 20 percent of the sales-people having the next most recent sales are given an R score of 2, and so forth, down to the last 20 percent, who are given an R score of 5. • The criteria them re-sorts the sales-people on the basis of how frequently they sell. The 20 percent of the sales-people who sell most frequently are given an F score of 1, the next 20 percent of frequently selling sales-people are given a score of 2, and so forth, down to the least frequently selling sales-people, who are given a F score of 5.
Finally, the criteria sorts the sales-people according of how much money they collect of their sales. The 20 percent who have more sales are given an M score of 1, the next 20 percent are given an M score of 2, and so forth, down to the 20 percent who sell the least, who are given an M score of 5. • We should use the salesperson-ranking scores who are the best salesperson according to their sales, and so they may receive a reward from their company. And while the company may put pressure on salespeople who make less sales to improve profits of the company.
Part F • Apply RFM methodology for the ranking of an entity other those already considered. Strive to create the most innovative and useful application of RFM methodology possible.
RFM methodology can be applied to understand the attributes of this high ticket item (*Ducati) and translate them into sales information, trends, and driving factors which business people can understand and apply to other, similar or not even similar items intended for sale in exclusive or mainstream markets . Marketed yet has a waiting list on every model ever made. This is a Ducati, an exclusive Italian motor bike that is not mass .
Part G • Describe what you think is proper domain for RFM ranking. What kind of problems are best suited for this analysis? What kinds are worst suited for this analysis?
RFM methodology is properly used in the domain of customer analyzation for behavior and defining market segments for sales targeting. • Some examples of industries in which it is used are retail (clothes), Direct mailing (mail coupons & brochures), and Database marketing • THE KINDS OF PROBLEMS OR DATA BEST SUITED FOR THIS ANALYSIS ARE PROBLEMS OF PRIORITIZING BETWEEN CLIENTS BASED ON THEIR HISTORY OF PURCHASE • IN SAY, FOR EXAMPLE, A HIGH END DEPARTMENT STORE LIKE BARNEY’S. THE STORE MANAGEMENT WILL WANT TO BE ABLE TO DIFFERENTIATE BETWEEN CLIENTS WHO • SHOP ON A DAILY, WEEKLY, AND MONTHLY OR EVEN YEARLY BASIS SO AS TO KNOW WHICH CUSTOMERS SHOULD GET PREFERENTIAL TREATMENT WHEN THEY ALL ARE • IN THE STORE AT THE SAME TIME. • WORST SUITED FOR THIS ANALYSIS WOULD BE TO APPLY IT TO SET RATE AND MANDATORY CUSTOMER DEBTS SUCH AS STATE AND FEDERAL TAXES.