Download
1 / 16
160 likes | 295 Views
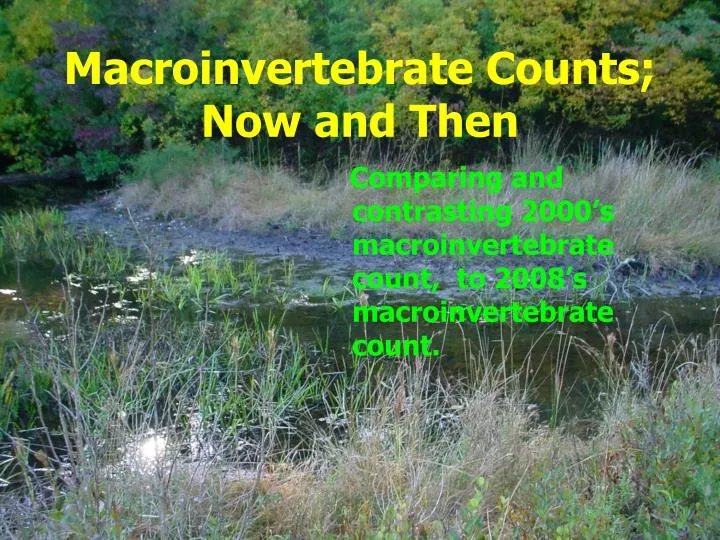
Macroinvertebrate Counts; Now and Then. Comparing and contrasting 2000’s macroinvertebrate count, to 2008’s macroinvertebrate count. Macroinvertebrates.

E N D
Macroinvertebrate Counts; Now and Then Comparing and contrasting 2000’s macroinvertebrate count, to 2008’s macroinvertebrate count.
Macroinvertebrates • Group1- Sensitive organisms, Includes pollution-sensitive organisms such as mayfly, stonefly, and caddisfly larva, which are typically found in good quality water. • Group 2- Somewhat sensitive organisms includes somewhat pollution- tolerant organisms such as, crayfish, sowbugs and clams, found in fair-quality water. • Group 3- Tolerant organisms includes pollution-tolerant organisms such as, worms, leeches, and midges, found in poor-quality water.
How we did it! • First we would take our plastic container with sediments • Then we would search the sediments carefully for any kind of movement • We would make sure not to harm the organisms in anyway • Once we found something we would determine what kind of macroinvertebrate it was by looking at the pictures on the ice container which was used to isolate the macros in their rightful place. • Lastly all the groups would combine their macroinvertebrate counts to form one biosurvey • This is how we separated and determined what group and what macroinvertebrate it was.
How does 2000’s Macro Count Compare to 2008’s • Depends on how much pollution the stream or creek has experienced over the years. • How much the past and present students have found out about are streams. • For example, if the past students worked harder to find out the streams problems they would have probably been more successful to make the stream better.
Is the Water Quality For Patcong Creek Acceptable in 2008 & 2000? • Poor, Fair, Good, or Excellent • Excellent= (> 22) • Good= (17-22) • Fair= (11-16) • Poor= (<11) The total index value for Patcong Creek in 2008 is 22 which means its just border lines good and excellent. That also means that the water quality in 2008 from Patcong Creek is acceptable. The total index value for Patcong Creek in 2000 is 32 which means the water quality is excellent. That also means that the water quality in 2000 from Patcong Creek is acceptable.
Is the Water Quality for Miry Run Acceptable in 2008? • Poor, Fair, Good, or Excellent • Excellent= (> 22) • Good= (17-22) • Fair= (11-16) • Poor= (<11) The total index value for Miry Run in 2008 is 28 which means the stream has a water quality of excellent. This also means the water quality is acceptable in 2008 for Miry Run. The total index value for Miry Run in 2000 is 37 which means the stream has a water quality of excellent. This also means that the water quality is acceptable in 2000 for Miry Run.
How do The Water Qualities from both Streams and Times Compare? Index Values from 2000 • Patcong Creek- 32 • Miry Run- 37 Index Values from 2008 • Patcong Creek- 22 • Miry Run- 28 Solution • The water quality is higher in 2000 from both streams. • Why is it higher? It is higher probably because of more pollution is occurring now than then. That would mean that the pollution is killing off most of the macroinvertibrates. Also, there was less construction going on in 2000 which probably means that the macroinvertebrates once lived in a natural un-residential area, which the macroinvertebrates were once comfortable in and lived peacefully un bothered .
How Can We Contribute to Our Streams to Make Them Healthier? • Less pollution and construction • More yearly check-ups on the streams could determine why the water qualities are lower than 2000’s. • Collecting more trash or debris near the streams could effect them in a positive way. • Educate our peers about the problems • Work with other organizations. • Learn and Serve America ( received grant to help ) • Partnership with Federal Aviation Administration William J Hughes Technical Center and Egg Harbor Township Schools • Lowe's home improvement store • ACUA • Spread the work about the fascinating species that reside right here in Egg Harbor Township. • Capture the public’s eye. • Less littering • Creating new habitats by adding new macroinvertebrates
Only when we can capture the public’s attention and gain their intrigue will we be able to restore the natural world around us to its once magnificent and terrific beauty.
THANKS! Thanks for listening, and I hope that you can make a difference in the local streams. Let’s try to accomplish getting the streams to how they used to be! • Lexus Eco Challenge- The Scuds