Download
1 / 44
440 likes | 596 Views
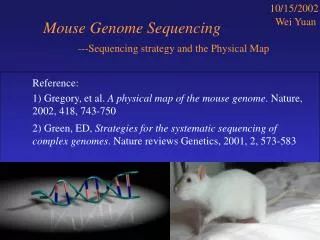
Comparison of mouse and man at genome level. Material of this lecture taken from the paper of the Mouse Genome Sequencing Consortium „Initial sequencing and comparative analysis of the mouse genome“, Nature 420 , 520-562 (5.12.2002). Excellent paper! Well readable!. Key findings:

E N D
Comparison of mouse and man at genome level Material of this lecture taken from the paper of the Mouse Genome Sequencing Consortium „Initial sequencing and comparative analysis of the mouse genome“, Nature 420, 520-562 (5.12.2002). Excellent paper! Well readable! Key findings: * the mouse genome is about 14% smaller than the human genome. The difference probably reflects a higher rate of deletion in mouse. * over 90% of the mouse and human genomes can be partitioned into corresponding regions of conserved synteny (segments in which the gene order in the most recent common ancestor has been conserved in both species) * at the nucleotide level, ca. 40% of the human genome can be aligned to the mouse genome. These sequences seem to represent most of the orthologous sequences that remain in both lineages from the common ancestor. The rest was probably deleted in one or both genomes. * the neutral substitution rate has been roughly half a nucleotide substitution per site since the divergence of the species. About twice as many of these substitutions have occurred in mouse as in human. Bioinformatics III
Comparison of mouse and man at genome level Key findings: * the proportion of small (50-100 bp) segments in the mammalian genome that is under (purifying) selection is ca. 5%, i.e. much higher than can be explained by protein-coding sequences alone. genome contains many additional features (UTRs, regulatory elements, non-protein-coding genes, chromosomal structural elements) under selection for biological function! * the mammalian genome is evolving in a non-uniform manner, various measures of divergence showing substantial variation across the genome. * mouse and human genomes each seem to contain ca. 30.000 protein-coding genes. The proportion of mouse genes with a single identifiable orthologue in the human genome is ca. 80%. The proportion of mouse genes without any homologue currently detectable in the human genome (and vice versa) is < 1%. Bioinformatics III
Key findings 3 * dozens of local gene family expansions have occurred in the mouse lineage: genes related to reproduction, host defence, immune response * despite marked differences in activity of transposable elements, similar types of repeat sequences have accumulated in the corresponding genomic regions. * by additional sequencing in other mouse strains, about 80.000 SNPs identified. Distribution of SNPs shows that genetic variation among mouse strains occurs in large blocks. Bioinformatics III
Background of mouse sequencing project Origins of the mouse human and mouse lineages probably diverted 65 million years ago Origins of mouse genetics already ancient Chinese references about mice with different colors by the 1700s mouse fanciers in Japan and China had domesticated many varieties as pets :-) Europeans subsequently imported favourites and bred them to local mice. Genetic mapping in the mouse began in 1915. Origins of mouse genomics mouse was included as of five central model organisms in Human Genome Project. Bioinformatics III
Generating the draft genome sequence Consortium selected strain B6 Sequencing strategy - first whole genome shotgun to generate draft sequence quickly - later generate physical map for producing a finished sequence Bioinformatics III
Sequencing - paired-end reads of different length! - 33.6 Million of 41.4 Million reads of sufficient quality - ca. 7-fold coverage The mouse genome. Nature420, 520 - 562 Bioinformatics III
Anchoring + Assembly - 2 assembly programs used: Arachne and Phusion. Comparable outputs. - most of the genome lies in supercontigs that are extremely large; the 200 largest supercontigs span more than 98% of the assembled sequence. - when compared to mouse genetic map no evidence for incorrect global joins within the supercontigs The mouse genome. Nature420, 520 - 562 Bioinformatics III
Chromosomal structure The mouse genome in 88 sequence-based ultracontigs. The position and extent of the 88 ultracontigs of the MGSCv3 assembly are shown adjacent to ideograms of the mouse chromosomes. All mouse chromosomes are acrocentric, with the centromeric end at the top of each chromosome. The supercontigs of the sequence assembly were anchored to the mouse chromosomes using the MIT genetic map. Neighbouring supercontigs were linked together into ultracontigs using information from single BAC links and the fingerprint and radiation-hybrid maps, resulting in 88 ultracontigs containing 95% of the bases in the euchromatic genome. The mouse genome. Nature420, 520 - 562 Bioinformatics III
Genome size total length 2.5 Gb The mouse genome. Nature420, 520 - 562 Bioinformatics III
Quality assessment at intermediate scale: - compare positions of well-studied markers on the mouse genetic map and in the genome assembly. 2605 markers were unambiguously mapped (E-value in BLAST of < 10-100 to a single location). Conflicts in 1.8% of the cases; typical accuracy of genetic maps. 11 cases investigated. In 10 cases, remapping of genetic map resolved problem. 1 case left: a 36 kb segment that was merged into the wrong contig. at fine scale: align genome to 10 Mb of finished BAC-derived sequence from B6 strain. 39 discrepancies of > 50 bp in length (median size of 320 bp) reflecting small misassemblies. Discrepancies typically occur at the ends of contigs in WGS assembly incorrect incorporation of a single terminal read. The mouse genome. Nature420, 520 - 562 Bioinformatics III
Unplaced reads and large tandem reads One expects that highly repetitive regions of the genome will not be assembled or anchored on the chromosomes. Indeed, 5.9 million of the 33.6 million reads were not part of anchored sequence. 88% of them are not assembled into sequence contigs, 12% belong to contigs but are not localized on a particular chromosome. A striking example: large region on Chr1 that contains a tandem expansion of sequence containing a Sp100-rs gene fusion. Region is highly variable, even among laboratory strains – estimated lengths ranging from 6 – 200 Mb. Bulk of this region not reliably assembled. From the sequence reads one estimates 493-fold coverage of Sp100-rs gene suggesting that there are ca. 60 copies in the B6 genome. (Consistent with estimate of 50 copies obtained by Southern blotting.) The mouse genome. Nature420, 520 - 562 Bioinformatics III
End of Assembly section –Now starts Analysis! Bioinformatics III
Conservation of synteny between human and mouse Starting from a common ancestral genome approximately 75 Million years ago, human and mouse genomes have each been shuffled by chromosomal rearrangements. The rate of these changes is low enough that local gene order remains largely intact. In their pioneering paper, Nadeau and Taylor, 1984 estimated that the mouse and human genomes could be parsed into roughly 180 syntenic regions – a surprisingly small number. Today, gene-based syteny maps define about 200 syntenic regions. The mouse genome. Nature420, 520 - 562 Bioinformatics III
Detect syntenic regions with PatternHunter - perform sequence comparison of entire mouse and human genome sequences to identify regions with a high similarity score > 40 (corresponding to a 40-base perfect match with penalties for mismatches and gaps) - also require that each sequence is the other‘s unique match above this threshold. Such regions probably reflect orthologous sequence pairs. About 558.000 pairs found! Mean spacing of 4.4 kb; N50 length of ca. 500 kb. Together they make up 7.5% of the mouse genome. But there may be many more that have evolved too quickly to be detected. The mouse genome. Nature420, 520 - 562 Bioinformatics III
Identify regions of conserved synteny Syntenic segment: maximal region in which a series of landmarks occur in the same order on a single chromosome in both species. Syntenic block: one or more syntenic segments that are all adjacent on the same chromosome in human and on the same chromosome in mouse; may otherwise be shuffled with respect to order and orientation. (only consider regions > 300 kb) Each genome could be parsed into a total of 342 conserved syntenic segments. On average, each landmark resides in a segment containing 1600 other landmarks. Segments vary greatly in length: 303 kb – 64.9 Mb. About 90.2 % of human and 93.3% of mouse genome unambigously reside with conserved syntenic segments. The mouse genome. Nature420, 520 - 562 Bioinformatics III
Conservation of synteny between human and mouse A typical 510-kb segment of mouse chromosome 12 that shares common ancestry with a 600-kb section of human chromosome 14 is shown. Blue lines connect the reciprocal unique matches in the two genomes. The cyan bars represent sequence coverage in each of the two genomes for the regions. In general, the landmarks in the mouse genome are more closely spaced, reflecting the 14% smaller overall genome size. The mouse genome. Nature420, 520 - 562 Bioinformatics III
Correspondence of syntenic regions Segments and blocks >300 kb in size with conserved synteny in human are superimposed on the mouse genome. Each colour corresponds to a particular human chromosome. The 342 segments are separated from each other by thin, white lines within the 217 blocks of consistent colour. The mouse genome. Nature420, 520 - 562 Bioinformatics III
Dot plots of conserved syntenic segments For each of three human (a–c) and mouse (d–f) chromosomes, the positions of orthologous landmarks are plotted along the x axis and the corresponding position of the landmark on chromosomes in the other genome is plotted on the y axis. Different chromosomes in the corresponding genome are differentiated with distinct colours. In a remarkable example of conserved synteny, human chromosome 20 (a) consists of just three segments from mouse chromosome 2 (d), with only one small segment altered in order. Human chromosome 17 (b) also shares segments with only one mouse chromosome (11) (e), but the 16 segments are extensively rearranged. However, most of the mouse and human chromosomes consist of multiple segments from multiple chromosomes, as shown for human chromosome 2 (c) and mouse chromosome 12 (f). Circled areas and arrows denote matching segments in mouse and human. The mouse genome. Nature420, 520 - 562 Bioinformatics III
Sytenic properties of human and mouse chromosomes The mouse genome. Nature420, 520 - 562 Bioinformatics III
Size distribution of elements with conserved synteny Size distribution of segments and blocks with synteny conserved between mouse and human. a, b, The number of segments (a) and blocks (b) with synteny conserved between mouse and human in 5-Mb bins (starting with 0.3–5 Mb) is plotted on a logarithmic scale. The dots indicate the expected values for the exponential curve of random breakage given the number of blocks and segments, respectively. The mouse genome. Nature420, 520 - 562 Bioinformatics III
Genome rearrangement? Using the methods from lecture 5 (Pevzner & Tesler algorithms) one can compute the minimal number of rearrangements needed to „transform“ one genome into the other. When applied to the 342 syntenic segments, the most parsimonious (=shortest) path has 295 rearrangements. The analysis suggests that chromosomal breaks may have a tendency to reoccur in certain regions. With only two species, however, it is not yet possible to recover the ancestral chromosomal order or reconstruct the precise pathway of rearrangements. This will become possible in short time as more and more mammalian species are sequenced. The mouse genome. Nature420, 520 - 562 Bioinformatics III
Next: Genome landscape - genome expansion and contraction What accounts for the smaller size of the mouse genome? See section on repeats. - (G + C) content In mammalian genomes, there is a positive correlation between gene density and (G + C) content. - CpG islands The mouse genome. Nature420, 520 - 562 Bioinformatics III
(G + C) content The overall distribution of local (G + C) content is significantly different between the mouse (blue) and human (red) genomes. In human, 1.4% of the windows have (G + C) > 56% and 1.3% with < 33%. Such extreme deviations are absent in the mouse genome. The reason for this difference is unknown. Both species have 75-80% of genes residing in the (G+C)-richest half of their genome (see below). Mouse shows similar extremes of gene density despite being less extreme in (G+C) content. The mouse genome. Nature420, 520 - 562 Bioinformatics III
CpG islands In mammalian genomes, the palindromic dinucleotide CpG is usually methylated on the cytosine residue. Methyl-CpG is mutated by deamination to TpG, leading to ca. 5-fold underrepresentation of CpG across the human and mouse genomes. In some genome regions that have been implicated in gene regulation, CpG dinucleotides are not methylated. Such regions, termed CpG islands are usually a few hundred Nt in length, have high (G + C) content and above average representation of CpG dinucleotides. Search genomes with program: detect regions on basis of (G + C) and CpG content. Mouse genome contains fewer CpG islands (15.500) than human (27.000). The mouse genome. Nature420, 520 - 562 Bioinformatics III
CpG islands (G+C) content and density of CpG islands shows more variability in human (red) than mouse (blue) chromosomes. a, The (G+C) content for each of the mouse chromosomes is relatively similar, whereas human chromosomes show more variation; chromosomes 16, 17, 19 and 22 have higher (G+C) content, and chromosome 13 lower (G+C) content. b, Similarly, the density of CpG islands is relatively homogenous for all mouse chromosomes and more variable in human, with the same exceptions. Note that the mouse and human chromosomes are matched by chromosome number, not by regions of conserved synteny. The mouse genome. Nature420, 520 - 562 Bioinformatics III
Repeats Repeats are the most prevalent feature of mammalian genomes. Most of them are interspersed repeats representing „fossils“ of transposable elements. Transposable elements are a principal force in reshaping the genome. Their fossils provide powerful reporters for measuring evolutionary forces on the genome. About 46% of the human genome can be recognized currently as interspersed repeats resulting from transposable elements during the past 150 – 200 million years. The total fraction derived from transposons could be considerably larger but fossils older than a certain age cannot be detected anymore due to the high degree of sequence divergence. Bioinformatics III
Repeats All mammals have essentially the same 4 classes of transposable elements: 1 LINE: autonomous long interspersed nucleotide element 2 SINE: LINE-dependent, short RNA-derived short interspersed nucleotide elements 3 LTR: retrovirus-like elements with long termain repeats 1 - 3 procreate by reverse transcription of an RNA intermediate 4 DNA transposons; move by a cut-and-paste mechanism of DNA sequence Bioinformatics III
Interspersed repeats 32.4% (mouse) of genome are lineage-specific repeats vs. 24.4% for human The mouse genome. Nature420, 520 - 562 Bioinformatics III
Interspersed repeats Mouse lacks ancestral repeats; they comprise only 5% of the mouse genome vs. 22% of the human genome. Median divergence levels of 18 subfamilies of interspersed repeats that were active shortly before the human-rodent specification indicates an approximately twofold higher average substitution rate in mouse than in human. Comparison of ancestral repeats to their consensus sequence also allows an estimate of the rate of occurrence of small (<50 bp) insertions and deletions. Both species show a net loss of nucleotides. The overall loss due to small indels in ancestral repeats is at least twofold higher in mouse than in human. (This contributes ca. 1-2% to the smaller size of the mouse genome). This is an average. Currently, the substitution rate per year in mouse is probably fivefold higher than in human. The mouse genome. Nature420, 520 - 562 Bioinformatics III
Density of interspersed repeat classes In both species, there is a strong increase in SINE density and a decrease in L1 density with increasing (G+C) content, with the latter particularly marked in the mouse. Another notable contrast is that in mouse, overall interspersed repeat density gradually decreases 2.5-fold with increasing (G+C) content, whereas in human the overall repeat density remains quite uniform. The mouse genome. Nature420, 520 - 562 Bioinformatics III
Similar repeats accumulate in orthologous locations Contrast in the genomic distribution of LINEs and SINEs: Whereas LINES are strongly biased towards (A + T) regions, SINEs are strongly biased towards (G + C) rich regions. Are (A + T) and (G + C) truly causative factors or merely reflections of an underlying biological process? Interpreation of analysis: SINE density is influenced by genomic factors that are correlated with (G + C)-content but that are distinct from (G + C) content per se. The mouse genome. Nature420, 520 - 562 Bioinformatics III
Mouse genes Evidence-based gene prediction 1 ENSEMBL gene prediction pipeline: - know protein-coding cDNAs are mapped onto the genome - additional protein-coding genes are predicted on the basis of similarity to proteins in any organism using GeneWise. - consider all those de novo gene predictions from GENSCAN that are supported by experimental evidence (such as ESTs) 2 augment with Genie gene prediction pipeline Bioinformatics III
Predicted Mouse genes The mouse genome. Nature420, 520 - 562 Bioinformatics III
Pseudogenes An important thing in annotating mammalian genomes is distinguishing real genes from pseudogenes (inactive gene copies). Processed pseudogenes arise through retrotransposition of spliced or partially spliced mRNA into the genome; they are often recognized by the loss of some or all introns relative to other copies of the gene. Unprocessed pseudogenes arise e.g. from duplication of genomic regions. They sometimes contain all exons, but often have suffered deletions and rearrangements. Over time, pseudogenes of either class tend to accumulate mutations that clearly reveal them to be inactive, such as multiple frameshifts or stop codons. They acquire a larger ratio of non-synonymous to synonymous substitutions (KA / KS) than functional genes. Bioinformatics III
Gapdh gene: example of a pseudogene The mouse genome contains only a single functional Gapdh gene, but there are > 400 pseudogenes distributed across 19 of the mouse chromosomes. Some these are readily identified as pseudogenes, but 118 have retained enough genic structure that the could be identified as pseudogenes only by manual inspection! Suspicious genes are: (1) genes that lack a corresponding gene prediction in the region of conserved synteny in the human genome (2705) (2) genes that are members of apparent local gene clusters and that lack a reciprocal best match in the human genome (5143). Authors estimate that 76% of first class and 30% of second class are pseudo- genes. They comprise ca. 12000 exons in the 213562 mouse gene catalogue. Bioinformatics III
Comparison of mouse and human gene sets Approximately 99% of mouse genes have a homologue in the human genome. For 96% the homologue lies within a similar conserved syntenic interval in the human genome. For 80% of mouse genomes, the best match in the human genome in turn has its best match against that same mouse gene. These are termed 1:1 orthologues. For less than 1% of the predicted mouse genes there was no homologous predicted human gene. Those genes that may seem to be mouse-specific may correspond to human genes that are still missing due to the incompleteness of the human genome sequence. De novo gene addition in the mouse lineage and gene deletion in the human lineage have not significantly altered the gene repertoire. Bioinformatics III
De novo gene prediction dual-genome de novo gene predition in 2 steps (1) retain only multi-exon gene predictions for which there were corresponding consecutive exons with an intron in an aligned position in both species. (2) require the presence of adjacent exons in both species Authors expect about 1000 new gene predictions would be validated by RT-PCR. Bioinformatics III
Mouse proteome Taxonomic breakdown of homologues of mouse proteins according to taxonomic range. Note that only a small fraction of genes are possibly rodent-specific (<1%) as compared with those shared with other mammals (14%, not rodent-specific); shared with chordates (6%, not mammalian-specific); shared with metazoans (27%, not chordate-specific); shared with eukaryotes (29%, not metazoan-specific); and shared with prokaryotes and other organisms (23%, not eukaryotic-specific). The mouse genome. Nature420, 520 - 562 Bioinformatics III
Gene ontology annotations Gene ontology (GO) annotations for mouse and human proteins. The GO terms assigned to mouse (blue) and human (red) proteins based on sequence matches to InterPro domains are grouped into approximately a dozen categories. These categories fell within each of the larger ontologies of cellular component (a) molecular function (b) and biological process (c) (D. Hill, personal communication). In general, mouse has a similar percentage of proteins compared with human in most categories. The apparently significant difference between the number of mouse and human proteins in the translational apparatus category of the cellular component ontology may be due to ribosomal protein pseudogenes incorrectly assigned as genes in mouse. The mouse genome. Nature420, 520 - 562 Bioinformatics III
Protein families As expected, most of the protein or domain families have similar sizes in human and mouse. Largest differences in high mobility group HMG1/2 and ubiquitin. The mouse genome. Nature420, 520 - 562 Bioinformatics III
Evolution of orthologues two measures: - percentage of amino acid identity - KA / KS ratio Orthologues generally have lower values for KA / KS e.g. < 0.05 because the proteins are subject to relatively strong purifying selection. The mouse genome. Nature420, 520 - 562 Bioinformatics III
Purifying selection Domain prediction with SMART: Domains are under greater purifying selection than regions not containing domains. Consistent with hypothesis that domains are under greater structural and functional constraints than unstructured, domain-free regions. Also, domain families with enzymatic activitiy were found to have a lower KA / KS ration than non-enzymatic domains. Bioinformatics III
Summary * the mouse genome is about 14% smaller than the human genome. The difference probably reflects a higher rate of deletion in mouse. * over 90% of the mouse and human genomes can be partitioned into corresponding regions of conserved synteny (segments in which the gene order in the most recent common ancestor has been conserved in both species) * at the nucleotide level, ca. 40% of the human genome can be aligned to the mouse genome. These sequences seem to represent most of the orthologous sequences that remain in both lineages from the common ancestor. The rest was probably deleted in one or both genomes. * the neutral substitution rate has been roughly half a nucleotide substitution per site since the divergence of the species. About twice as many of these substitutions have occurred in mouse as in human. Bioinformatics III
Summary * the proportion of small (50-100 bp) segments in the mammalian genome that is under (purifying) selection is ca. 5%, i.e. much higher than can be explained by protein-coding sequences alone. genome contains many additional features (UTRs, regulatory elements, non-protein-coding genes, chromosomal structural elements) under selection for biological function! * the mammalian genome is evolving in a non-uniform manner, various measures of divergence showing substantial variation across the genome. * mouse and human genomes each seem to contain ca. 30.000 protein-coding genes. The proportion of mouse genes with a single identifiable orthologue in the human genome is ca. 80%. The proportion of mouse genes without any homologue currently detectable in the human genome (and vice versa) is < 1%. Bioinformatics III