Download
1 / 25
250 likes | 359 Views
PAISA Planning, Allocations & Expenditures, Institutions: Studies in Accountability. India’s elementary education budget is rising………………. …………but outcomes are in a “BIG STUCKâ€. Children who can read std 2 level text (story level). No correlation between per-child cost and learning outcomes.

E N D
PAISAPlanning, Allocations & Expenditures, Institutions: Studies in Accountability
India’s elementary education budget is rising………………
…………but outcomes are in a “BIG STUCK” Children who can read std 2 level text (story level)
No correlation between per-child cost and learning outcomes * Children in Std 5 that can read std 2 textbook (story level)
Why don’t outlays translate in to outcomes? • Are we allocating the right resources in the right activities? • Is money reaching its destination? • Who takes expenditure decisions? • Are these linked to needs on the ground? • There is very little empirical understanding of how increased allocations translate to actions (planning and decision making, fund flows) as a result inefficiencies from one year (or one scheme) simply translate to the next year.
Introduction to PAISA • PAISA District Studies • In depth detailed tracking of the entire chain of government money and decision making • 9 Districts in 7 States : AP, Medak, Bihar, Nalanda & Purnea; Himachal Pradesh, Kangra; Madhya Pradesh, Sagar, Maharashtra, Satara; Rajasthan, Jaipur & Udaipur and West Bengal, Jalpaigudi • Analysis of State Budget and GOI PAB minutes • Analysis of district AWPs & Monthly Expenditure Statements. • School survey: 140 (average) schools per district. Total sample 1,311 • PAISA National Report • Survey focuses on 3 core grants that every school in the country receives • Survey undertaken through ASER • PAISA is now in its 3rd year • Over 14,280 schools visited in 2011 • Survey conducted through citizens groups making PAISA the first and only national effort to track expenditure • Key questions: • Do schools get their money? • If so, when do schools get their money? • Do schools get all their money? • How do schools spend their money?
Top down financing. Teachers receive the highest proportion of the elementary education budget (2009-11) School grants are the only annual grant that SMC’s have complete spending power over. These accounted for 5% of the total SSA budget in 2010-11.
Last minute rush to devolve funds to districts Monthly Fund flows to Kangra, HP (2010-11)
Schools get their money by the end of September / October Money arrives half way into the school year School year begins
School’s don’t always get their money, although its better than we expected…………..
Significant variation in grant receipt across districts % Schools Reporting Grant Receipt in both 2009-10 and 2010-11
Last minute rush to spend. Recurring expenditures are prioritized Sagar, Madhya Pradesh
Last minute rush to spend. Recurring expenditures are prioritized Satara, Maharashtra
Expenditures are often incurred after the close of the FY (60 day gap between grant receipt & first day of spending)
Implications of late arrivalStories from schools…… • Schools use their own money to purchase essential supplies and ‘adjust accounts’ • Delays in fund flows have a knock on effect. Eg. Civil works money • Lack of clarity on understanding expenditure norms • Cumbersome procedures • Schools do not get information on grant arrival • Centralization in spending which limits discretion at the school level. Udaipur & : Purnea case • Lack of clarity on decision makers at the ground level
Immediate tasks…….some tinkering on the edges……. • Financial Management: Simplification of procedures and greater flexibility in resource allocation and utilization • Training of officials in basic financial management procedures particularly related to civil works • Greater transparency in fund flows (SMS alerts) and regular tracking of fund flows at the school level to improve speed
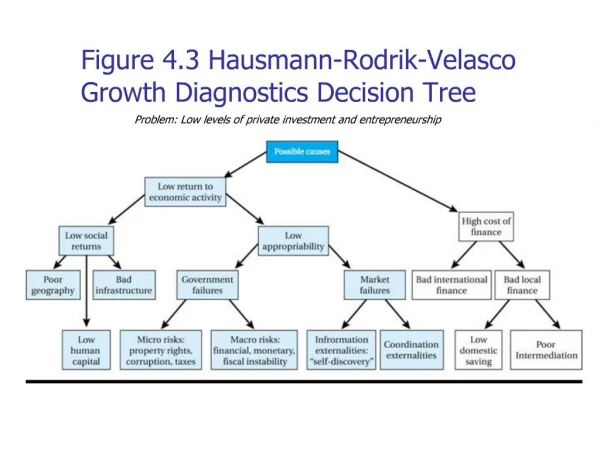
But can this top down system deliver outcomes? • Focus needs to shift from macro inputs to micro processes. Requires a system that defines goals and objectives and enables innovation linked to needs. Flexibility and autonomy are the key ingredients of such a system. This needs: • More focus on district and school planning • Greater engagement of school management committee • District and block to ‘facilitate’ and ‘support’ schools • What would the decision making, planning and fund flow tree look like?


![REGIONAL ALLOCATIONS - PROGRAM 5 [REV 3.6] 2002 / 3](https://cdn2.slideserve.com/3723446/slide1-dt.jpg)