Download
1 / 7
70 likes | 195 Views
[12-2B] Box & Whisker Plots. Learning Objective Students will display and interpret data in box and whisker plots. CW/HW P2357: Textbook, p. 695 #1-12 P4: Skills Practice. Creating a box-and-whisker plot: 17,18,9,10,6,5,6,10,14,12,11,8.

E N D
[12-2B] Box & Whisker Plots Learning Objective Students will display and interpret data in box and whisker plots. CW/HWP2357: Textbook, p. 695 #1-12 P4: Skills Practice
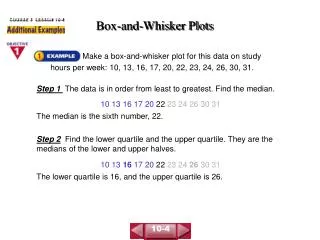
Creating a box-and-whisker plot:17,18,9,10,6,5,6,10,14,12,11,8 A box-and-whisker plot is a diagram that summarizes the data by dividing it into four parts. 1) Order the data from least to greatest. 5,6,6,8,9,10,10,11,12,14,17,18
5,6,6,8,9,10,10,11,12,14,17,18 (10+10) ÷ 2 = 10 3) Find the upper quartile, the median of the top half. 2) Find the median. (12+14) ÷ 2 = 13 4) Find the lower quartile, the median of the lower half. (6+8) ÷ 2 = 7
5,5,6,8,9,10,10,11,12,14,17,18 |7 |10 |13 5) Draw a number line that will fit all your data. |5 | | | | |10 | | | | |15 | | | | |20 6) Plot the LE, LQ, M, UQ, UE. LE=Lower Extreme (Low #) UE=Upper Extreme (High #)
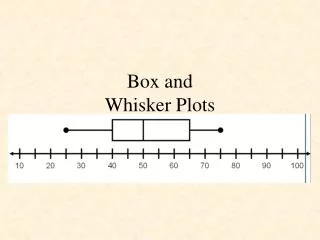
7) Draw your box & whiskers.Boxes connect the median and quartiles and whiskers connect the extreme to the quartiles. |5 | | | | |10 | | | | |15 | | | | |20
Create a box and whisker plot for the data set: 12, 8, 4, 5, 6, 2, 3, 2, 1 |0 | | | | |5 | | | | |10 | | | | |15
Create a box and whisker plot for this set of data. 5, 17, 9, 11, 12, 10, 9, 8, 7, 6 [12-3] Review |5 | | | | |10 | | | | |15 | | 18