Download
1 / 29
290 likes | 408 Views
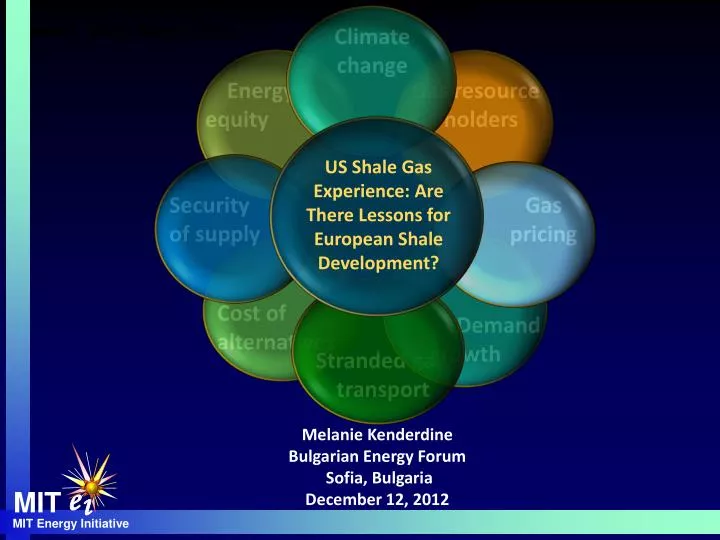
MIT-Sabancı University Energy and Security Workshop Istanbul, 30-31 March 2012. Climate change. Energy equity. Gas resource holders. US Shale Gas Experience: Are There Lessons for European Shale Development? . MIT Energy Initiative. Security of supply.

E N D
MIT-Sabancı University Energy and Security Workshop Istanbul, 30-31 March 2012 Climate change Energy equity Gas resource holders US Shale Gas Experience: Are There Lessons for European Shale Development? MIT Energy Initiative Security of supply Gas pricing Cost of alternatives Demand growth Stranded gas, transport Melanie Kenderdine Bulgarian Energy Forum Sofia, Bulgaria December 12, 2012 e i MIT
Global Energy Challenges, Trends • Shale Gas: the US Experience • Environmental Impacts of Shale Production, US Regulation • European Shale Gas: Issues, Potential • Conclusions MIT Energy Initiative e i MIT
Global Shale Opportunities: Changing Geopolitics (technically recoverable shale resources compared + 2009 consumption (Tcf)) North America 1,931 / 27.4 South America 1,000 / 5.6 Africa 1,006 / 4.8 Libya 290 0.2 Brazil 226 0.7 Argentina 774 1.5 France 180 1.73 Canada 388 3.0 Algeria 231 1.02 Poland 187 0.6 China 1,275 3.1 Australia 396 1.1 Europe* 640 / 19.3 Asia-Pacific 1671 / 23.6 MIT Energy Initiative Mexico 681 2.2 U.S. 862 22.8 South Africa 485 0.2 e i *UK, France, Poland, Germany, Norway, Netherlands, Denmark, Sweden, Ukraine, Turkey, Lithuania, others MIT Source: EIA, World Shale Resources , 2011
Global Gas Supply Cost Curve* Breakeven Gas Price** $/MMBtu Even with uncertainty, there is a significant amount of low cost gas resources MIT Energy Initiative Tcf of Gas • * Excludes unconventional gas outside North America • ** Cost curves based on 2007 cost bases. North America cost represent wellhead breakeven costs. All curves for regions outside North America represent breakeven costs at export point. Cost curves calculated using 10% real discount rate, ICF Hydrocarbon Supply Model e i MIT Source: MIT Future of Natural Gas Study, 2011
EIA Forecast – US Gas Production to 2035 MIT Energy Initiative e i MIT Source: EIA, Richard Newell Presentation, 2010
U.S. Gas Supply Cost Curves Breakdown of Mean U.S. Supply Curve by Gas Type , Breakeven Gas Price* Aggregate Breakeven Gas Price* Shales There are significant shale resources with lower costs than conventional gas MIT Energy Initiative $/MMbtu $/MMbtu Conventionals * Cost curves calculated using 2007 cost bases. U.S. costs represent wellhead breakeven costs. Cost curves calculated assuming 10% real discount rate, ICF Hydrocarbon Supply Model 6 Tcf e i MIT Source: MIT Future of Natural Gas Study, 2011
CO2 Mitigation with Carbon Price to 2050 Electric Sector MIT Energy Initiative Gas Coal e i MIT Source: MIT Future of Natural Gas Study, 2011
Benchmark NG Prices in US, UK, Japan Approx. $14 MIT Energy Initiative Approx. $9 Approx. $4 e i MIT Sources: IEA, Natural Gas Information, 2011; Liquid Markets: Assessing the Case for U.S. Exports of Liquefied Natural Gas, Brookings, May, 2012
Shale Gas RD&D Spending and Supporting Policy Mechanisms Gas produced after tax credit MIT Energy Initiative GRI Funding Steady over 16 years Federal Funding Time limited tax credit Gas produced under tax credit e i MIT
Variation in Shale Well Performance/ Economics Impact of IP Rate Variability on Breakeven Price (BEP)* (2009 Well Vintages) P20 P50 P80 MIT Energy Initiative IP Mcf/d IP Mcf/d IP Mcf/d IP Mcf/d IP Mcf/d Barnett 860 3,920 2,700 2,000 1,610 7,730 3,500 1,140 2,340 3,090 1,960 5,500 790 2,600 12,630 BEP $/Mcf BEP $/Mcf BEP $/Mcf BEP $/Mcf BEP $/Mcf $6.53 $3.85 $13.42 $4.27 $6.31 $5.53 $8.87 $11.46 $5.12 $6.34 $4.12 $17.04 $4.02 $2.88 $3.49 48% Fayetteville Haynesville Marcellus** Woodford e i MIT * Breakeven price calculations carried out using 10% real discount rate ** Marcellus IP rates estimated based on industry announcements and available regulatory data Source: MIT, HPDI production database and various industry sources Source:MIT Future of Natural Gas Study, 2011
Coal to Gas Fuel Substitution Benefits, contd. US CO2 emissions lowest in 20 years MIT Energy Initiative A mild winter that reduced household heating demand A decline in coal-fired electricity generation, due largely to historically low natural gas prices Reduced gasoline demand e i MIT Source: EIA Website
US Unconventional Gas: Economic Benefits $80 billion in new investment in energy-intensive industries **Petrochemicals**Aluminum**Steel**Rubber** Fertilizer**Glass MIT Energy Initiative • 2010 Avg. Savings from Lower Gas Prices in Ohio Contribution to GDP Contribution to Consumers Contribution to Industry Industrial: $87,000 Commercial: $1,386 Contribution to Govt. Revenues Residential: $214 Source: The Economic and Employment Contributions of Unconventional Gas Development in State Economies, IHS, 2012 Source: Dow Chemical, “Industrial Demand and LNG Exports”, SNL Energy interview, Oct. 3, 2012
US Shale Gas Regulation: A Work in Progress • Four major areas of environmental concern with shale gas production: • Water use and contamination • Air emissions • Site disruptions • Seismic activity MIT Energy Initiative e i MIT
Mapped Fracture Growth in the Marcellus MIT Energy Initiative Around 1,000 ft. Around 4,000 ft. Around 2,000 ft. e i MIT Source: MIT Future of Natural Gas Study, 2011
Comparative Water Use, US Shale Plays (%bbl/year) MIT Energy Initiative e i MIT Source: MIT Future of Natural Gas Study, 2011
Key Shale Gas Environmental Issues Breakdown of Widely-Reported Environmental Incidents Involving Gas Drilling; 2005-2009 Primary environmental risks associated with shale gas development Contamination of groundwater aquifers with drilling fluids or natural gas On-site surface spills of drilling fluids, fracture fluids and wastewater Contamination as the result of inappropriate off-site wastewater disposal Excessive water withdrawals for use in high-volume fracturing operations Excessive road traffic and degraded air quality MIT Energy Initiative Source: MIT Future of Natural Gas Study, 2011 16
Recommendations • For optimum long-term development, need to improve understanding of shale gas science and technology • Government-funded fundamental research • Industry/govt collaboration on applied research • Should also cover environmental research • Determine and mandate best practice for gas well design and construction • Create transparency around gas development • Mandatory disclosure of frac fluid components • Integrated water usage and disposal plans • Continue to support research on methane hydrates MIT Energy Initiative e i MIT
it is also clear is that the production of shale gas and Methane Emissions from Shale Production Methane Emissions from Shale Gas Wells (mg/well) MIT Energy Initiative 228 12 mg/well “…the production of shale gas [has] not materially altered the total GHG emissions…for the vast majority of contemporary shale gas wells.” “…the revenues gained from using reduced emissions completions…cover the cost of executing such completions.” 216 e i MIT Shale gas production: potential versus actual greenhouse gas emissions O’Sullivan & Paltsev, Environmental Research Letters, 11/12
Induced Seismicity and Hydraulic Fracturing Some Induced Seismic Events Rangely, CO, injection experiments (M4.9, 1995), 1945-1995 Rocky Mountain Arsenal (M5.3, 1967), fluid injection, 1962-1966 Gazli, Uzbekistan, gas recovery (M7.2), 1976-1984 Water Reservoirs: Lake Mead (M5), Koyna (M6.3), Oroville (6.1) Tadjikistan, Italy and many others Geysers Geothermal Field (M4.6), injection-enhanced production Dallas Airport (M3.3), fluid injection, 2008-2009 Arkansas (M4.7), fluid injection, 2010-2011 Youngstown, Ohio (M4.0), fluid injection, 2011 Managing Induced Seismicity Avoid injection into active faults Minimize pore pressure changes at depth Install local seismic monitoring arrays Establish modification protocols in advance Be prepared to alter plans or abandon wells* MIT Energy Initiative Induced Seismicity Research Needs Data Collection Instrumentation Hazard and Risk Assessment Modeling e i MIT Sources: Managing the seismic risk posed by wastewater disposal, Zoback, 2012; I Induced Seismicity Potential in Energy Technologies, National Research Council, 2012
Public & regulatory communications Operator Best Practices Protocol for Induced Seismicity Hazard assessment MIT Energy Initiative Risk assessment Criteria for ground vibration Seismic monitoring Mitigation plans e i MIT Induced Seismicity Potential in Energy Technologies, National Research Council, 2012
US Federal Regulation/Mgmnt of Shale Gas • Environmental Protection Agency • Authorities: Clean Air Act, Safe Drinking Water Act, Clean Water • Act, Toxic Substances Control Act • Bureau of Land Management • Land and water best practices for production on federal land • White House Executive Orders • Inter-agency task force on shale gas production • + • Regional and state regulation • Delaware River Basin, Texas, Pennsylvania, New York, Colorado, • Wyoming, West Virginia…. MIT Energy Initiative e i MIT
Potential, Issues with Development of European Shale Basins Population density Higher drilling costs Deeper deposits, smaller basins compared to US Subsurface ownership Lack of infrastructure Legal frameworks inadequate More stringent environmental regulations Industry structure Lack of experienced, skilled workers MIT Energy Initiative e i MIT
Barnett Shale: 13,5000 Wells Drilled in 12 Years MIT Energy Initiative e i MIT Sources: EIA, Richard Newell Presentation, 2010
Marcellus/Pennsylvania Population Density & European Shale Development MIT Energy Initiative Poland Shale Basins Poland Population Density e i MIT Source: EIA, World Shale Resources , 2011
Illustrative Operational Requirements for Shale Development Communities are disrupted, communities need input and buy-in MIT Energy Initiative 28 bcm/yr production (1 tcf), operational requirements over 15 year period e i MIT Source: Geny, OIES, 2010, Honore, OIES Gas Research Program, 2011
EU Communication on Energy Security, 2010 Natural gas…. will gain importance as the back-up fuel for variable electricity generation …in the medium term depleting indigenous conventional natural gas resources call for additional, diversified imports [of natural gas] Gas networks face additional flexibility requirements in the system, the need for bi-directional pipelines, enhanced storage capacities and flexible supply, including liquefied (LNG) and compressed natural gas (CNG) MIT Energy Initiative Single-source dependency, compounded by a lack of infrastructure, prevails in Eastern Europe. A diversified portfolio of physical gas sources and routes and a fully interconnected and bidirectional gas network, where appropriate, within the EU are needed already by 2020 e i MIT
Crisis Response: Roadmap for Greater European Energy Security/Integration Response Options Alternative fuel redundancy Interconnections Reverse flows Storage Increased pipeline gas Increased LNG imports Main Infrastructure Beneficiaries Interconnected countries with adequate storage and fuel redundancy fared the best Add Eastern Mediterranean gas development Shale gas development More LNG in Mediterranean ring Moral of the Story: relatively inexpensive energy security can be achieved with more storage, interconnections, increased imports (+ shale gas/E. Mediterranean) Germany Increased imports from Norway, Netherlands, used storage Poland ½ cut covered by Yamal, gas from Norway, gas storage used Anatomy of European Response to Supply Lost in Russia/Ukraine Disruption, 2009 Slovakia Used storage for several weeks, covered 75% of demand, alternative fuel used Hungary Increased gas from Norway, gas storage, alternative fuel used • Hungary increased pipeline flows to Serbia, Bosnia • Netherlands flows to UK decreased • UK interconnector reversed • Yamalflows increased • Blue Stream flows increased % of Gas Supply Lost in Disruption Europe Regasification Capacity Current: 187.4 Under construction: 23.0 Subtotal 210.4 Planned: 260.6 TOTAL 471.0 LNG Consumption 79 bcm Capacity factor: 42% Czech Republic Increased imports from Norway, used storage, increased production Romania Increased production, used storage Austria Increased imports from Norway, Germany, used storage MIT Energy Initiative United Kingdom Serbia Used fuel oil for 20 days Belarus Netherlands Poland Germany Day 11 Immediate Day 3 Day 9 Ukraine Belgium Slovenia Increased gas from Algeria/Austria, storage in Austria Czech Rep. Bulgaria Used storage for 2-3 days, covered 35% of demand, alternative fuel used Slovakia France Moldova Austria Hungary Switzerland Slovenia Romania • Croatian production/ offtake increased • Additional spot LNG to Turkey, Greece • Flows reversed from Czech Republic to Bosnia • Flows reversed from Greece to Bulgaria Croatia Serbia Italy Increased imports from Libya, Norway, Netherlands, used storage Bosnia/H. Bulgaria Italy Macedonia Used fuel oil for industry Macedonia Spain Albania Turkey Greece Croatia Increased production, used storage Greece Increased LNG shipments, one gas plant switched to oil Bosnia Herzegovina Used fuel oil for 21 days e i MIT Source: Vulnerability and Bargaining Power in EU-Russia Gas Relations, Christie, et al, 2011 >50% 100% <50%
European/US Gas Consumption/ Storage, 2010, bcm European countries that lost 70-100% of gas in 2009 disruption US: 15% more gas consumption MIT Energy Initiative Storage Consumption, Capacity 2010 US storage as % of consumption: 18% All Europe: 15% Disruption subset: 10% Balkans subset: 5.7% US: 42% more gas storage e i MIT Source: IEA, Natural Gas Information, 2011
Uncertainties in European Gas Supply/Demand Higher demand/prices in Asian markets Arab spring Reduced indigenous production Caspian geopolitics Shale gas development Arctic development North African demand Eastern Mediterranean development Global economy S u p pp l y MIT Energy Initiative Reduction in renewable subsidies Aftermath of Fukushima German policy decisions Plans for life extension of old nuclear plants Impacts of EU policy – “20% by 2020” Global economy D e m a n d e i MIT