Download
1 / 33
370 likes | 664 Views
Building and Managing the Lean Supply Chain. The Supply Chain. Distribution Channels. 1 st Tier, 2 nd Tier, …, Suppliers. Enterprise. Customers. The Supply Chain. Develop Systems Thinking. Lean supply chain principle 1:

E N D
The Supply Chain Distribution Channels 1st Tier, 2nd Tier, …, Suppliers Enterprise Customers The Supply Chain
Develop Systems Thinking Lean supply chain principle 1: Improving the performance of every subsystem does not necessarily improve system performance. The sum of local optima does not equate to the global optimum. Improvements in subsystem performance must be gauged only through its impact on the whole system.
Systems Thinking and the Theory of Constraints “Find the essence of each situation, like a logger clearing a log jam. The pro climbs a tall tree, locates the key log, blows it, and lets the stream do the rest. An amateur would start at the edge of the jam and move all the logs, eventually moving the key log. Both approaches work, but the essence concept saves time and effort. Almost all problems have a key log if we learn to find it.” -- Fred Smith
Competitors Regulating Agencies Distribution Channels 1st Tier, 2nd Tier, …, Suppliers Enterprise Customers The Supply Chain Stakeholders Complementors The Business Ecosystem
The Business Ecosystem Lean supply chain principle 2: Focus on improving the performance of the lean supply chain. However, do not ignore the supply chain’s business ecosystem.
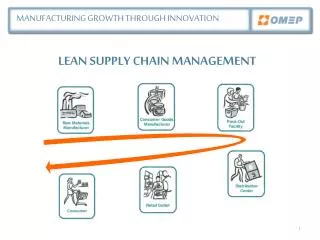
Steps to Build Lean Supply Chains • Develop a systems perspective • Understand customers and their expectations • Map the supply chain • Benchmark best practices • Design products and processes to manage demand volatility • Create flow across the supply chain • Develop supply chain metrics
Develop a Systems Perspective • For any decision you take consider the following. Does the decision: • Help you sell more products? • Help reduce investments in resources? • Help reduce payments/expenses?
Understand Customer Value • Critical step: provide what the customer wants • Providing the wrong product or service in an efficient way is muda. Eg. Air travel • An opportunity for kaikaku (dramatic change): • Rethink the delivery system on a product line basis with strong dedicated product teams
Understanding Customer Value • Document the following: • Customer values in each segment (order qualifiers and order winners) • Delivery cycle/time expectations of customers in each segment • Identify market segments
Market Segmentation Graph 60% 40% %age Orders 20% Market Segment 0% Staple Direct Seasonal Stock Freight Product Type Market Segments: Example
Customer Values in Each Segment • Staple stock (e.g., Stationery) • Availability (qualifier), cost (winner) • Direct freight (e.g., Sony DSC-S30) • Product design (qualifier), quality (winner) • Seasonal • Convenience (qualifier), availability (winner)
Map the Supply Chain • The set of all actions required to deliver the finished product or service to the customer • “Seeing the Whole” (Systems Thinking) • Systematic study of the value stream often reveals a staggering amount of muda • Need to “map” the whole process, and identify value-added and non-value added activities across the value stream
Medical Records Physician’s Office Admission RN or Therapist Outside Supplier Transcription Intake Coordinator Visit Scheduler Clinical Staff Materials Management Hospital Discharge Staff Clinical Supervisor Billing and Collections Supply Chain Map: “As-Is” Courier Patient Telemonitoring System monitored by Office based Nurse Information flow Paper flow Data flow Supply delivery Adds Value Source of Waste
Physician or Physician’s Office Patient Telemonitoring System monitored by Office based Nurse Outside Supplier Clinical Supervisor /Case Manager Intake Coordinator/ Scheduler Medical Records Clinical Staff Hospital Discharge Staff Billing and Collections Materials Management Supply Chain Map: “To-Be” Information flow Data flow Supply delivery Adds Value Source of Waste
Monthly Fax of Weekly Schedules Central Supplies Production Planning 30 Days Firm Schedule Customer Supplier Weekly Calls with Daily Schedules InventoryManagement System CAPS System Bi-Weekly Schedule Record Receipt To Raw Material Supermarket Press- Curing DFM Sales Warehouse Press- Curing slab Blend Compound Pre- Form Pre- Cure Finish- ing Pack FIFO 900 seconds 5700 seconds 18 seconds 4500 seconds 18810 seconds 45 seconds 0.07 seconds 0 Days 0.26 Days 0.09 Days 0.09 Days 0.68 Days 0.54 Days 12 Days 1.33 Days Value Added Time: 0.35 days; Production Lead Time 3.34 days; Value Added Ratio: 10.5% Customer Demand: 4,560 units/day Supply Chain Map: “As-Is”
Mixed-Model Build Schedule Monthly Fax of Weekly Schedules Central Supplies Production Planning 30 Days Firm Schedule Customer Supplier Weekly Calls with Daily Schedules InventoryManagement System CAPS System Daily Orders Bi-Weekly Schedule Record Receipt To Raw Material Supermarket Press- Curing DFM Sales Warehouse Press- Curing slab Blend Compound Pre- Form Pre- Cure Finish- ing FIFO 900 seconds 1800 seconds 18 seconds 4500 seconds 18810 seconds 45 seconds 0 Days 0.11 Days 0 Days 0.03 Days 0.13 Days 6 Days 0.03 Days Value Added Time: 0.30 days; Production Lead Time 0.60 days; Value Added Ratio: 50% Customer Demand: 6,200 units/day Supply Chain Map: “To-Be”
Benchmark Best Practices Develop performance metrics Identify world class organizations; study their operations strategies and tactics
Benchmark Best Practices Lean supply chain principle 3: Focus on customer needs and process considerations when designing the product delivery system. Enterprises can gain tremendous competitive advantage through best-in-class practices that cut across industries.
Designing Products and Processes: Coping With Demand Volatility • Can you smooth demand volatility? • Key observation: Much of the demand volatility is self-induced • Sales promotions and rebates • End-of-the-month syndrome (“Channel Stuffing”) • Batching • New product introductions • …
How Can We Reduce Demand Volatility? • Have no promotions • Reduce lead times and produce in small lots • Exploit product structures • Postponement strategies • Exploit commonality and delay commitment • Aggregation
How to Manage Demand Volatility: The RAP Principle Raw Material Before Finished Goods Fabrication Sub-Assembly Final Assembly After
How to Manage Demand Volatility: The RAP Principle Lean supply chain principle 4: Maximize external variety with minimal internal variety. It is desirable to maintain inventories in an undifferentiated form for as long as it is economically feasible to do so
Managing Demand Variation • As far as possible, avoid using inventory to buffer variation • Less chances of misallocation • Inventory seriously impedes flow Lean supply chain principle 5: Buffer the variation in demand with capacity, not inventory
Product Delivery Strategies “At-Lead-Time” Customers “Beyond-Lead-Time” Customers “At-Once” Customers Percentage of Orders Wk 1 Wk 2 Wk 3 Wk 4 Wk 5 Wk 6 Wk 7 Wk 8 Replenishment Lead Time Lead Time = 3 to 5 weeks The Customer Time-Based Demand Profile
Product Delivery Strategies: Product Structures • Build to stock (BTS) • Finished goods made in anticipation of demand. Customers’ orders are met from inventory • Assemble to order (ATO) • Subassemblies produced according to forecast. Required items are drawn from wip and assembled when orders are received. Very little finished goods inventory carried
Product Delivery Strategies: Product Structures • Build to order (BTO) • Products built in response to actual customer orders. Usually these are standard products with a few options • Engineer to order (ETO) • New product designed and produced in response to specific customer needs. Lead times include relevant elements of engineering design and manufacturing
Customer LT Product Structures: Resulting Lead Times FG Build to Stock Assemble-to-Order Assembly Customer LT Build-to-Order RM Assembly Customer LT
Create Flow • Creating flow requires a systems perspective • Lack of flow results in inventory or work imbalance somewhere in the supply chain • Improved flow reduced lead times • To create flow, all processes should “row the boat” at the same pace – the concept of flow balance Facility Customers Suppliers
Creating Flow • To enhance flow, use pull signals for execution where possible Lean supply chain principle 6: Use forecasts to plan and pull to execute. A system that reacts to pull signals will have less variation than a comparable system that adopts a push mode of operation.
Develop Metrics Using a Systems Perspective • “Tell me how you will measure me and I will tell you how I will behave.” • Does the metric: • Help you sell more products? • Help reduce investments in resources? • Help reduce payments/expenses?