Download
1 / 26
260 likes | 435 Views
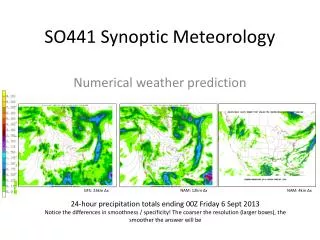
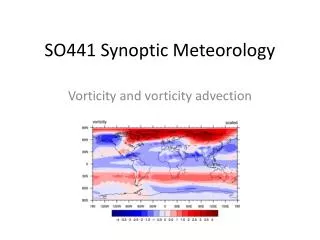
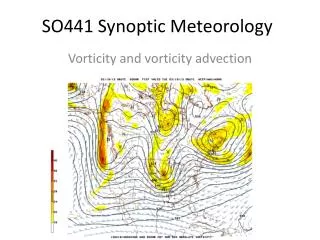
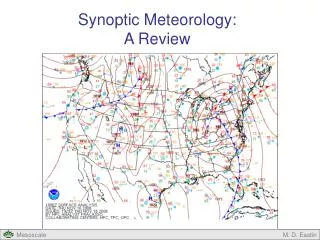
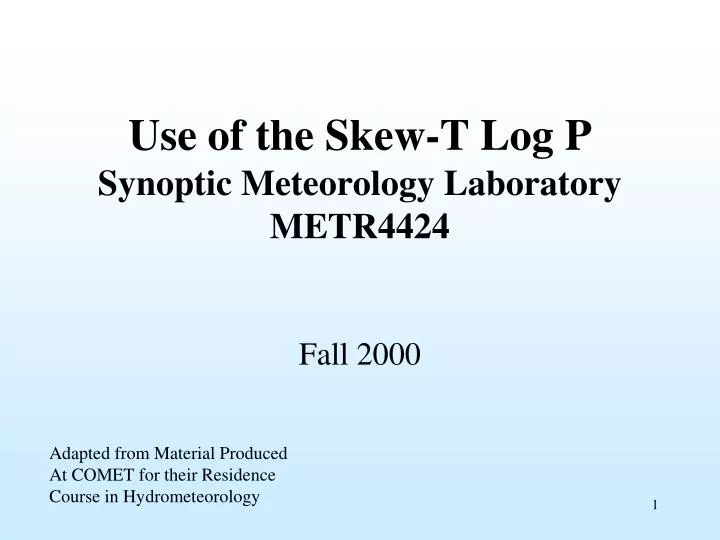
Use of the Skew-T Log P Synoptic Meteorology Laboratory METR4424. Fall 2000. Adapted from Material Produced At COMET for their Residence Course in Hydrometeorology. Atmospheric Stability. Stable versus Unstable Dry and Moist Adiabatic Processes Skew-T Log-P Diagrams.

E N D
Use of the Skew-T Log PSynoptic Meteorology LaboratoryMETR4424 Fall 2000 Adapted from Material Produced At COMET for their Residence Course in Hydrometeorology
Atmospheric Stability • Stable versus Unstable • Dry and Moist Adiabatic Processes • Skew-T Log-P Diagrams
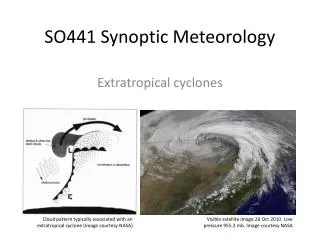
Atmospheric Stability (cont.) • Stable versus Unstable Stable equilibrium Unstable equilibrium
Atmospheric Stability (cont.) • Adiabatic Processes • Parcel of air expands and cools, or compresses and warms, with no interchange of heat with the surrounding environment • An adiabatic process is reversible • If the parcel doesn’t saturate, then cooling or warming occurs at the dry adiabatic lapse rate • Constant in our atmosphere10 oC / km
Atmospheric Stability (cont.) • If the parcel does saturate and ascent is occurring... • Condensation (RH = 100%), Latent Heat is released • Latent Heating offsets some of the cooling • Cooling at slower rate: moist adiabatic lapse rate • Not constant, varies with temperature and moisture Average value ~ 6 oC / km • Not reversible (heat added, moisture probably removed) • Pseudo-adiabatic process
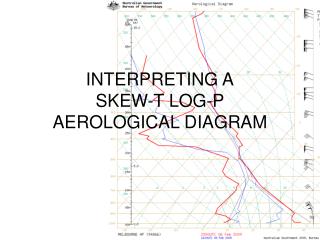
Skew-T Log-P Diagram • Convenient way to look at the vertical structure of the atmosphere • Determine unreported meteorological quantities • Assess parcel stability • Used to display observations or model output • Developed by the U.S. Air Force
Skew-T Log-P Diagram (cont.) • Basic Definitions • mixing ratio (w) • mass of vapor to mass of dry air • saturation mixing ratio (ws) • maximum for a given T and P • wet-bulb temperature (Tw) • equilibrium T when water evaporates from a wetted-bulb thermometer at a rate where latent heat lost is balanced by flow of heat from surrounding warmer air • potential temperature () • temperature of air if brought dry-adiabatically to 1000 mb • vapor pressure (e) • partial pressure of water vapor
Skew-T Log-P Diagram (cont.) • Basic Definitions (cont.) • virtual temperature (Tv) • temperature dry air at pressure P would have so its density equals that of a moist parcel at T and P • dew point temperature (Td) • temperature of a parcel cooled to saturation at constant P • relative humidity • 100 x (mixing ratio / saturation mixing ratio) • specific humidity (q) • mass of vapor to mass of moist air (nearly the same as mixing ratio) • equivalent temperature (Te) • temperature air would have if all of its latent heat were released
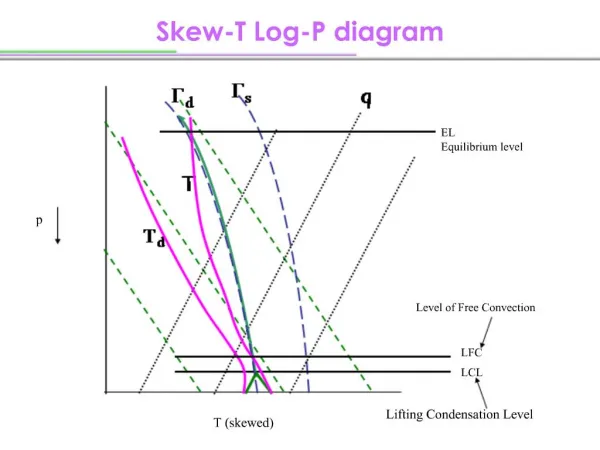
Skew-T Log-P Diagram (cont.) • Basic Definitions (cont.) • equivalent potential temperature (e) • temperature of a parcel if all moisture condensed out (latent heat released) then the parcel brought dry-adiabatically to 1000 mb • Convective condensation level (CCL) • Height where rising parcel just becomes saturated (condensation starts) • Convective temperature (Tc) • T that must be reached for a surface parcel to rise to CCL • Lifting condensation level (LCL) • Height where parcel becomes saturated by lifting dry-adiabatically • Level of free convection (LFC) • Height where parcel lifted dry-adiabatically until saturated, then moist-adiabatically, first becomes warmer than the surrounding air
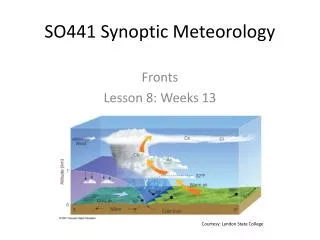
Skew-T Log-P Diagram (cont.) • Basic Definitions (cont.) • Positive area (or CAPE) • Area between the sounding and the moist adiabat that intersects the CCL, above the CCL. Proportional to the amount of energy the parcel gains from the environment. • Negative area (or CIN) • Area between the sounding and the dry adiabat that intersects the CCL, below the CCL. Proportional to the energy needed to move the parcel. • Equilibrium level (EL) • Height where the temperature of a buoyant parcel again becomes equal to the temperature of the environment. • Wet bulb zero • Height above ground where the wet bulb first reaches zero degrees Celsius. This is the level where hail will begin to melt.
Skew-T Diagram Isobars
Skew-T Diagram Isotherms
Skew-T Diagram Dry Adiabats
Skew-T Diagram Moist Adiabats
Skew-T Diagram Saturation Mixing Ratio
EL CAPE + LI LFC CIN Cape Canaveral, FL