Download
1 / 68
680 likes | 689 Views
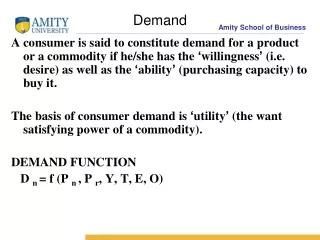
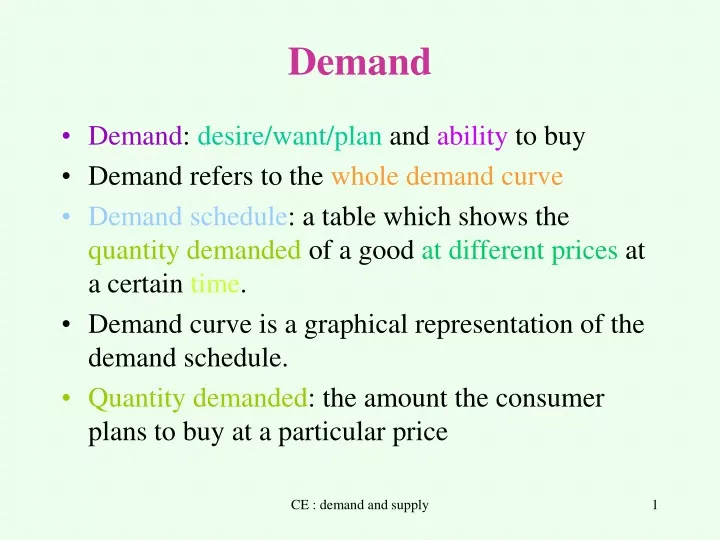
Demand. Demand : desire/want/plan and ability to buy Demand refers to the whole demand curve Demand schedule : a table which shows the quantity demanded of a good at different prices at a certain time . Demand curve is a graphical representation of the demand schedule.

E N D
Demand • Demand: desire/want/plan and ability to buy • Demand refers to the whole demand curve • Demand schedule: a table which shows the quantity demanded of a good at different prices at a certain time. • Demand curve is a graphical representation of the demand schedule. • Quantity demanded: the amount the consumer plans to buy at a particular price CE : demand and supply
Demand • Individualdemand curve/schedule • Marketdemand: horizontal summation of the individual demand curves/schedules. CE : demand and supply
The Demand Curve and the Law of Demand The demand curve for a good is a graphical presentation of the demand schedule. It shows the quantity demanded for a good at different prices. It is downward sloping. CE : demand and supply
Price P1 P2 D Quantity Q1 Q2 The demand curve for good X CE : demand and supply
The Law of Demand • The law of demand states that the quantity demanded of a good decreases as the price of the good increases, vice versa, other things constant. • The demand curve is downward sloping. • The law of demand is represented by a movement along the demand curve. CE : demand and supply
Factors Affecting the Demand for a Good • The price of the good • The income of the consumer • The price of other related goods • The change in preference/fashion • Expectation of future price • The size of the population • Derived demand ( factors of production ) • Other possible factors CE : demand and supply
Price of the good: Change in quantity demanded • The higher the price, the lower the quantity demanded will be, vice versa, other things constant. ( The law of demand ) • It is represented by amovement along the demand curve CE : demand and supply
Movement along the Demand Curve Price P1 P2 D Q1 Q2 Quantity CE : demand and supply
Shift of the Demand Curve: Change in Demand • The income of the consumer: Normal and inferior good When the income of a consumer increases, the quantity demanded of a good increases at each price level. The good is called anormal good ( Positive income effect ) For some goods, when income increases, the quantity demanded decreases at each price level. These goods are called inferior goods. (Negative income effect ) CE : demand and supply
Shift of the Demand Curve • The price of other goods Substitute goods ( Good X and Good Y ) When the price of good X increases, the demand for good Y increases. Complements ( Good X and Good Y ) When the price of good X increases, the demand for Good Y decreases. CE : demand and supply
Shift of the Demand Curve • The change in preference/fashion The demand for a good increases when it becomes fashionable to consume the good. CE : demand and supply
Shift of the Demand Curve • Expectation of future price When consumers expect the price of a good to increase in the future, they will consume more of it now. CE : demand and supply
Shift of the Demand Curve • The size of the population An increase in the size of population will increase the demand for goods. CE : demand and supply
Shift of the Demand Curve • Derived demand ( the demand for factors of production ) ( 衍生 需求 ) When the demand for a good increases, the demand for the factor inputs will increase. For instance, when the demand for medical services increases, the demand for doctors and nurses also increases. CE : demand and supply
Shift of the Demand Curve: Increase in demand Price P D2 D1 CE : demand and supply Q1 Q2 Quantity
Shift of the Demand Curve: Decrease in demand Price P D1 D2 Quantity Q2 CE : demand and supply Q1
Increase in demand When the demand for a good increases, the demand curve for the good shifts to the right. More of the good is demanded at each price level. Decrease in demand When the demand for a good decreases, the demand curve for the good shifts to the left. Less of the good is demanded at each price level. Shift of the Demand Curve CE : demand and supply
Supply • Supply: desire/want/plan and ability to sell • Supply refers to the whole supply curve. • Supply schedule: a table which shows the quantity supplied of a good at different prices, at a certain time. • Supply curve is a graphical representation of the supply schedule. • Quantity supplied: the amount the consumer plans to sell at a particular price CE : demand and supply
Supply • Individual supply curve/schedule • Market supply: horizontal summation of the individual supply curves/schedules. CE : demand and supply
The Supply Curve The supply curve of a good is a graphical presentation of the supply schedule. It shows the quantity supplied of a good at different prices. It is upward sloping. CE : demand and supply
Price S P1 P2 Quantity Q2 Q1 CE : demand and supply
Factors affecting the Supply of a Good • The price of the good • Price of other goods • Price of factor input/Production cost • State of technology • Per unit sales tax • Per unit subsidy • Number of sellers • Other possible factors. CE : demand and supply
The Price of the Good:Change in Quantity Supplied • The higher the price, the higher the quantity supplied will be, vice versa, other things constant. • It is represented by amovement along the supply curve CE : demand and supply
Movement along the Supply Curve Price S P1 P2 Q2 Quantity CE : demand and supply Q1
Shift of the Supply Curve: Change in Supply • Price of other goods • Competitive supply( Good X and Good Y ) When the price of Good X increases, the supply of Good Y decreases. • Joint supply( Good X and Good Y ) When the price of Good X increases, the supply of Good Y also increases. CE : demand and supply
Shift of the Supply Curve: Change in Supply • Price of factor input/Production cost An increase in the cost of production will lead to a decrease in the supply of the good. CE : demand and supply
Shift of the Supply Curve: Change in Supply • State of technology An improvement in the state of technology will lead to an increase in the supply of a good. CE : demand and supply
Shift of the Supply Curve: Change in Supply • Per unit sales tax (t) The imposition of a per unit sales tax ‘t’ leads to a decrease in the supply of the good. The vertical distance of the supply curves measures the per unit sales tax ‘t’. CE : demand and supply
Shift of the Supply Curve: Change in Supply • Per unit subsidy (s) The imposition of a per unit subsidy ‘s’ leads to an increase in the supply of the good. The vertical distance of the supply curves measures the per unit subsidy ‘s’. CE : demand and supply
Shift of the Supply Curve: Change in Supply • Number of sellers An increase in the number of sellers leads to an increase in the supply of the good. CE : demand and supply
Shift of the Supply Curve: Increase in supply Price S1 S2 P Quantity Q1 Q2 CE : demand and supply
Shift of the Supply Curve: Decrease in supply S2 Price S1 P Quantity Q2 CE : demand and supply Q1
Increase in supply When the supply of a good increases, the supply curve of the good shifts to the right. More of the good is supplied at each price level. Decrease in supply When the supply of a good decreases, the supply curve of the good shifts to theleft. Less of the good is supplied at each price level. Shift of the Supply Curve CE : demand and supply
Equilibrium Price and Quantity Price S Excess supply P1 P* P2 Excess demand D Quantity Q* CE : demand and supply
Change in Equilibrium Price and Quantity Price S P2 P1 D2 D1 Quantity Q1 Q2 Increase in demand CE : demand and supply
Change in Equilibrium Price and Quantity Price S P1 P2 D2 D1 Quantity Q2 Q1 Decrease in demand CE : demand and supply
Change in Equilibrium Price and Quantity Price S1 S2 P1 P2 D Q2 Quantity Q1 Increase in supply CE : demand and supply
Change in Equilibrium Price and Quantity Price S2 S1 P2 P1 D Quantity Q2 Q1 Decrease in supply CE : demand and supply
Change in Equilibrium Price and Quantity Question: What happen to the equilibrium price and quantity when both the demand and supply change? CE : demand and supply
Quantity demanded, Quantity supplied and Quantity transacted • Quantity demanded refers to the quantity of a good a consumer plans to buy at each price. • Quantity supplied refers to the quantity of a good a consumer plans to sell at each price. • Quantity transacted/exchanged = quantity bought and sold It refers to the quantity of a good a consumer actually buys/a producer actually sells at each price. CE : demand and supply
Quantity demanded, Quantity supplied and Quantity transacted Price S P2 P1 D Quantity Q2 Q1 Q3 At P1, Quantity transacted = Quantity demanded and supplied = Q1 At P2, Quantity transacted = Q2; Quantity demanded < Quantity supplied CE : demand and supply
Quantity demanded, Quantity supplied and Quantity transacted Price S P1 P3 D Quantity Q1 Q5 Q4 At P1, Quantity transacted = Quantity demanded and supplied = Q1 At P3, Quantity transacted = Q4; Quantity demanded > Quantity supplied CE : demand and supply
Elasticity of demand Definition The price elasticity of demand measures the percentage change in quantity demanded in response to a percentage change in the price of a good. CE : demand and supply
Elasticity of demand =% change in quantity demanded % change in price CE : demand and supply
Elasticity of demand ( Ed ) CE : demand and supply
Elasticity of demand and Total Revenue Total revenue/Sales revenue ( Producer’s viewpoint ) = Total Expenditure ( Consumer’s viewpoint ) TR/TE = P.Q P = Price Q = Quantity transacted CE : demand and supply
Elasticity of demand and Total Revenue ( An increase in Price ) CE : demand and supply
Elastic demand and Total Revenue (An increase in Price ) P Increase in revenue < Loss in revenue P2 Increase in revenue P1 Loss inrevenue D Q CE : demand and supply Q2 Q1
Inelastic demand and Total Revenue (An increase in Price ) P > Gain in revenue Loss in revenue P2 Gain in revenue P1 Loss in revenue D Q CE : demand and supply Q2 Q1
Perfectly inelastic demand and Total Revenue (An increase in Price ) Price D P2 Increase in revenue P1 Q Quantity CE : demand and supply