Download
1 / 52
520 likes | 645 Views
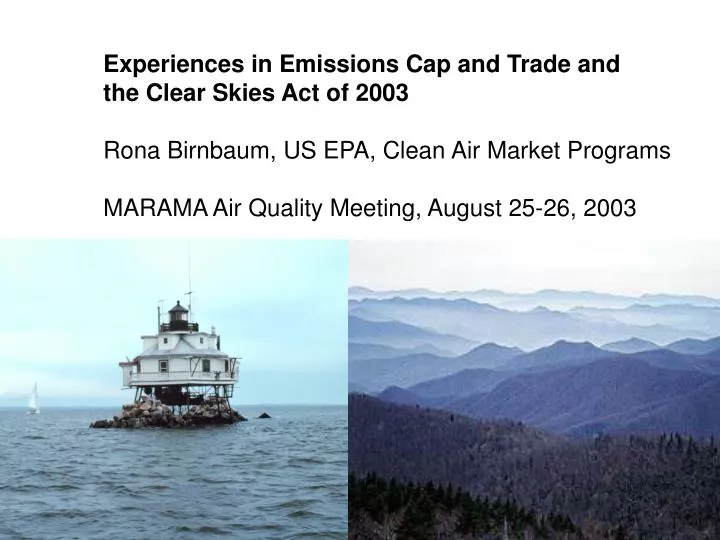
Experiences in Emissions Cap and Trade and the Clear Skies Act of 2003 Rona Birnbaum, US EPA, Clean Air Market Programs MARAMA Air Quality Meeting, August 25-26, 2003. SO 2 Cap and Trade Program. New mechanism established in 1990 CAAA

E N D
Experiences in Emissions Cap and Trade and the Clear Skies Act of 2003 Rona Birnbaum, US EPA, Clean Air Market Programs MARAMA Air Quality Meeting, August 25-26, 2003
SO2 Cap and Trade Program • New mechanism established in 1990 CAAA • Set goals and control requirements in terms of allowable emissions • Reduced and capped total emissions, ensuring attainment and maintenance • Required measurement and reporting of all emissions • Allowed flexibility in compliance choice, including emissions trading, to minimize cost • Established automatic penalties and offsets to assure compliance • Retained requirements to protect local air quality, regardless of trading
30 25 Without Acid Rain Program 20 Million tons 15 Allowable Emissions 10 With Acid Rain Program 5 0 1980 1985 1990 1995 2000 2005 2010 Goal of SO2 Program • Reduce SO2 emissions by 10 million tons from 1980 level-- 8.5 million tons from power generation through “cap and trade” mechanism SO2 Reductions from Power Generation
Acid Rain Program Results: SO2 Emission Reductions 17.3 16.1 15.7 13.1 13.0 12.5 12.5 11.9 Million Tons SO2 Allowances issued for 263 Phase I units, 1995 – 1999; and for all affected sources beginning in 2000.
Acid Rain Program Results:Monitored Reduction in Wet Sulfate Deposition 1989-1991 1999-2001 Acid Rain has decreased by 25% in sensitive regions of the Northeast
Acid Rain Program Results:Decrease in SO2 Concentration 1989-1991 1999-2001
Acid Rain Program Results:Low Annual Compliance Cost 2010 Projected Costs Actual costs 75% lower than 1990 projections • Reasons for low cost • Competition across emission reduction options • Continuous incentive for innovation • Banking provides timing flexibility • Allowance price provides benchmark for decision making • Trading not restricted Enactment 4 Yrs Later 8 Yrs Later
Lessons learned from the Acid Rain Program • Designed to reduce SO2 emissions on a broad, regional, interstate scale • Cap and trade mechanism has worked • Greatest reductions in SO2 emissions have occurred in states with the highest emissions • Significant reductions in SO2 emissions have resulted in dramatic decreases in acid rain -- as much as 30% -- in acid-sensitive ecosystems • Trading has not created hot spots • Independent analyses (i.e., ELI, RFF, and EDF) have found that trading under the Acid Rain Program has not created hot spots • Trading has not harmed SO2 attainment status • No negative impact on re-designation to attainment • No evidence of adverse impact on monitored attainment areas • While the program has “worked,” acid deposition levels continue to be a concern
The OTC Achieved Substantial NOx Reductions • RACT and Acid Rain Program achieved initial NOx reductions. • Budget program reduced emissions 35% beyond RACT. • 2002 ozone season emissions 60% below 1990 levels. • Emissions below budget each year. • Reductions even on days with highest emissions. Note: The increase in budgets and emissions from 2000-2002 were a result of sources from MD and DC being phased into the program. The 1999 budget includes early reduction credits.
Reductions Have Been Evenly Distributed • All states achieved reductions from 1990 levels. • Similar reductions achieved in Inner (59%) and Outer (58%) Zones . • Most substantial declines in counties with high emissions in 1990. Note: Results for DC and RI do not appear on the map because of their small scale (<700 tons) 1990 Baseline Emissions 2002 Budget 2002 Actual Emissions Scale: New Jersey 1990 baseline equals approximately 47,000 tons.
The OTC NOx Budget Program Became a Model for the NOx SIP Call
Using the “cap and trade” model, expectations for Clear Skies include: • Major reductions in SO2, NOx, and Hg emissions from highest emitting sources • Broad, regional reductions of PM concentrations, ozone, and sulfur, nitrogen and mercury deposition • Significant early reductions (by 2010) in emissions
Why Clear Skies? • Air quality has improved, but our best science says health and environmental problems remain -- many result from long-range transport • Current path to improved air quality is complex • The Clear Skies approach addresses power industry pollution with a proven path: • Simpler and more certain -- for regulators, industry, and citizens • More flexible and cost effective -- allows for strategic planning of capital (i.e., avoided stranded investment) and cobenefits from control technologies (i.e., mercury removal) • Greater environmental improvement sooner via faster emission reductions than under current CAA regulations
Sulfur Dioxide: Nitrogen Oxides: Mercury: SO2 Air Quality Acidification Fine Particles Regional Haze Ozone formation Fine Particles Eutrophication Acidification Regional Haze Toxic bioaccumulation Pollutants and Concerns • Premature death • Serious respiratory illness (e.g., asthma, chronic bronchitis) • Premature death • Serious respiratory illness • Impairs cognitive and motor skills • Impairs reproductive, immune and endocrine systems
Regional Air Pollution is a Problem Urban v. Regional Contribution to Fine Particle Concentrations -- 2000 Annual Average, ug/m3
Clear Skies Addresses Long-Range Transport • Air pollution can travel hundreds of miles and cause multiple health and environmental problems on regional or national scales • A multi-pollutant approach addresses multiple issues over large geographic areas including • formation of particulate matter and ozone • reduced visibility • acidification of lakes and streams • degraded forest ecosystems • eutrophication of coastal waters • mercury deposition • Because air pollutants cross local, state, and national boundaries, states and communities cannot independently resolve all of their air pollution problems. NOx Airsheds for Four Estuaries Hudson/Raritan, Chesapeake Bay, Pamlico, and Altamaha Emissions in an airshed are responsible for the majority (but not all) of the nitrogen deposition that occurs in the receptor region (in this case an estuary)
Power Generation is a Major Source of Emissions Fuel Combustion- electric utilities Other stationary combustion * Industrial Processing Transportation Miscellaneous 2000 Sulfur Dioxide 2000 Nitrogen Oxides Utilities (22%) Utilities (63%) 1999 Mercury Utilities (37%) * Other stationary combustion includes residential and commercial sources.
Power Plants Face a Complex Set of Requirements NSR Permits for new sources & modifications that increase emissions Note: Dotted lines indicate a range of possible dates. 1 Further action on ozone would be considered based on the 2007 assessment. 2 The SIP-submittal and attainment dates are keyed off the date of designation; for example, if PM or ozone are designated in 2004, the first attainment date is 2009 EPA is required to update the new source performance standards (NSPS) for boilers and turbines every 8 years 8-hr Ozone Attain- ment Demon- stration SIPs due Designate areas for 8-hr Ozone NAAQS 1-hr Severe Area Attainment Date Marg-inal 8-hr Ozone NAAQS Attain-ment Date Assess Effectiveness of Regional Ozone Strategies Moderate 8-hr Ozone NAAQS Attainment Date Ozone 1-hr Serious Area Attainment Date NOx SIP Call Red-uc-tions Possible Regional NOx Reductions ? (SIP call II)1 OTC NOx Trading NOx SIPs Due Serious 8-hr Ozone NAAQS attainment Date 04 06 07 08 09 10 12 13 15 16 17 18 05 00 01 02 03 11 14 99 Compliance for BART Sources Mercury Determination Proposed Utility MACT Final Utility MACT Compliance with Utility MACT Compliance for BART sources under the Trading Program Second Regional Haze SIPs due New Fine PM NAAQS Implementation Plans Designate Areas for Fine PM NAAQS Latest attainment date for Fine PM NAAQS 3 Phase II Acid Rain Compliance Interstate Transport Rule to Address SO2/ NOx Emissions for Fine PM NAAQS and Regional Haze In developing the timeline of current CAA requirements, it was necessary for EPA to make assumptions about rulemakings that have not been completed or, in some case, not even started. EPA’s rulemakings will be conducted through the usual notice-and-comment process, and the conclusions may vary from these assumptions. Regional Haze SIPs due Acid Rain, PM2.5, Haze, Toxics
Clear Skies Sets a Firm Timeline for Emission Reductions Current Emissions (2000) Phase 1 Cap Phase 2 Cap Projected Emission Reductions Sulfur Dioxide (tons) 11 million 4.5 million (2010) 3 million (2018) 73% Nitrogen Oxides (tons) 5 million 2.1 million (2008) 1.7 million (2018) 67% Mercury (tons) 48 26 (2010) 15 (2018) 69%
Clear Skies Uses a Proven Cap and Trade Approach How It Works: • An emissions cap is set • Allowances equal to the cap are distributed • Each allowance authorizes set amount of emissions (e.g., one ton, one ounce) • Sources choose how to meet targets • Controls, fuel switching, buying allowances • Sources continuously measure and report emissions • Must hold sufficient allowances to cover emissions • Through national health-based standards, states and local governments retain authority to address local impacts • Program objective is clear, measurable, and relevant to environmental goal • All emissions are accounted for • There are incentives for doing better and consequences for doing worse Why It Works:
The Clear Skies Sulfur Dioxide (SO2) Program • Under Title IV of the CAAA, SO2 emissions from the electric power sector are reduced about 50% from a 1980 emissions level of 17.5 million tons when a 8.95 million tons emission cap goes into effect in 2010. • The Clear Skies Act establishes a new 4.5 million ton SO2 cap in 2010 and then lowers the cap to 3.0 million tons in 2018. • Clear Skies maintains the annual, national trading program established under Title IV. • Existing SO2 allowances dated 2010 and later removed from accounts and replaced with a proportionately smaller amount of Clear Skies allowances. • SO2 allowance allocations gradually replaced by auction over 52 years. • The Western Regional Air Partnership’s (WRAP) 2018 SO2 emissions milestone for power generators in 9 States would be honored through a backstop cap-and-trade program.
The Clear Skies SO2 Program • Why a national program? • The human health and environmental effects to which SO2 emissions contribute are of national concern. Emissions of SO2: • Contribute to fine particulate (PM2.5), which in aggregate is associated with premature mortality, chronic bronchitis, respiratory and cardiovascular related hospital admissions, and asthma attacks. • Cause PM2.5 NAAQS non-attainment, regional haze, and acid rain. • Atmospheric transport of emissions can pose problems in neighboring States. • Most of the plants that would be subject to the Clear Skies Act are currently participants in the national Acid Rain SO2 Program. • Building off the existing SO2 trading program minimizes disruption of the existing allowance market and ensures lower costs for power companies and customers. • Current banked allowances would increase their value and sources would continue to have an incentive to reduce their emissions early.
The Clear Skies NOx Program • The Zone boundaries are established based on the nature, magnitude, and source of environmental concerns. • All the States in Zone 1 either have ozone/PM2.5 non-attainment concerns or contain sources that contribute to other States’ ozone/ PM2.5 nonattainment. • Zone 2 includes: • States participating in the WRAP process: Arizona, California, Colorado, Idaho, Montana, Nevada, New Mexico, North Dakota, Oregon, South Dakota, Utah, Washington, Wyoming. • Oklahoma, Kansas, and Nebraska: These states do not appear to contribute to ozone or PM2.5 non-attainment areas. • The Western portion of Texas: Texas was divided between Zone 1 and Zone 2 to reflect the State’s Air Quality regulations and Electricity Industry Restructuring Legislation. • As with SO2, during the first phase the EPA Administrator will review new scientific, technology, and cost information; if necessary, EPA can recommend that Congress adjust the Phase II NOx cap.
The Clear Skies Mercury Program • Mercury deposition is a nationwide issue: • Currently 44 States have fish advisories. • Clear Skies emissions reductions may allow States to remove advisories or provide less restrictive advice for some water bodies. • Power generation is the largest remaining man-made source of mercury emissions in the U.S. (approximately 37% of total). • In 2000, coal-fired power generators emitted 48 tons of mercury. The Clear Skies Act will cut mercury emissions from coal-fired power generators by 69% when fully implemented. • The Clear Skies Act establishes a national, annual cap of 26 tons in 2010, and then lowers the cap to 15 tons in 2018. • Under Clear Skies, the primary reductions in mercury emissions will be in the ionic form, the form of mercury that is prone to deposit close to its source. • During the first phase, the EPA Administrator will review new scientific, technology, and cost information; if necessary, EPA can recommend that Congress adjust the Phase II mercury target. • As is the case currently, States can require facility-specific reductions to address local concerns.
Projected Emissions from Electric Generating Units • The Clear Skies Act will result in significant over-compliance in the early years, particularly for SO2, because sources are allowed to bank excess emissions reductions and use them later. The use of these banked allowances for compliance in the later years of the program (e.g., 2020) results in SO2 and mercury emissions initially above the second phase cap, gradually declining to the cap level. • Based on current technological capabilities, the cost of mercury removal is expected to reach the safety valve price ($35,000/lb) by 2010. However, technological improvements could decrease the cost of mercury control over time and cause prices to remain below safety valve levels. EPA saw scrubber costs drop and performance improve during the 1990s when the power sector faced regulatory controls for SO2. There is no significant change in projected SO2 and NOx emissions when Clear Skies is modeled without the safety valve. Note: Projected emissions data for SO2, NOx and mercury are from IPM. Note: The analysis presented represents EPA’s estimates. EIA’s modeling would likely show different impacts.
Power Industry Emissions of Sulfur Dioxide Note: Data reflect sources > 25MW. Total emissions under existing programs (Base Case) in 2010 would be 9.9 million tons; total emissions under Clear Skies in 2010 would be 6.1 million tons; total emissions under Clear Skies in 2020 would be 4.3 million tons. Emissions will continue to decline after 2020 until the cap level is reached. Existing control programs include Title IV, the NOx SIP Call, NSR settlements, and state-specific caps in CT, MA, MO, NC, NH, TX, and WI. It does not include mercury MACT in 2007 or any other potential future regulations to implement the current Clean Air Act. Base case emissions in 2020 will likely be lower due to state and federal regulatory actions that have not yet been promulgated. 1,259 thousand tons Scale: Alaska and Hawaii are not included in EPA’s model of sources connected to the continental U.S. electricity grid
Power Industry Emissions of Nitrogen Oxide Note: Data reflects power plants > 25MW. Total emissions under existing programs (Base Case) in 2010 would be 3.9 million tons; total emissions under Clear Skies in 2010 would be 2.1 million tons; total emissions under Clear Skies in 2020 would be 1.7 million tons. Existing control programs in IPM include Title IV, the NOx SIP Call, NSR settlements, and state-specific caps in CT, MA, MO, NC, NH, TX, and WI. It does not include mercury MACT in 2007 or any other potential future regulations to implement the current Clean Air Act. Base case emissions in 2020 will likely be lower due to state and federal regulatory actions that have not yet been promulgated. 267 thousand tons Scale: Alaska and Hawaii are not included in EPA’s model of sources connected to the continental U.S. electricity grid
NOx Emissions from Electricity Generation Sources NOx emissions from electricity generation sources within the Chesapeake Bay nitrogen airshed in 2020
Power Industry Emissions of Mercury Note: Data reflects coal-fired power plants > 25MW. Total emissions under existing programs (Base Case) in 2010 would be 45 tons; total emissions under Clear Skies in 2010 would be 27 tons; total emissions under Clear Skies in 2020 with the safety valve triggered would be 22 tons. Emissions will continue to decline after 2020 until the cap level is reached. Existing control programs in IPM include Title IV, the NOx SIP Call, NSR settlements, and state-specific caps in CT, MA, MO, NC, NH, TX, and WI. It does not include mercury MACT in 2007 or any other potential future regulations to implement the current Clean Air Act. Base case emissions in 2020 will likely be lower due to state and federal regulatory actions that have not yet been promulgated. 4.8 tons Scale: Alaska and Hawaii are not included in EPA’s model of sources connected to the continental U.S. electricity grid
Clear Skies Delivers Public Health and Environmental Benefits Compared to the Base Case, Clear Skies delivers: • Reduced fine particle and ozone exposure, beginning immediately and by 2020 resulting in $110 billion in annual public health benefits, including: • 14,100 avoided premature deaths; • 8,800 fewer cases of chronic bronchitis; • 23,000 fewer non-fatal heart attacks; • 12.5 million fewer days with respiratory-related symptoms, including lost work days, restricted activity days, and school absences; and • 30,000 fewer hospitalizations and ER visits for cardiovascular and respiratory causes • An alternate estimate projects 8,400 avoided premature deaths and annual health benefits totaling $21 billion • $3 billion in annual visibility benefits at select national parks and wilderness areas • Reductions in sulfur, nitrogen, and mercury deposition to improve the health of lakes, streams, and estuaries • Virtual elimination of chronically acidic lakes in the Northeast • Other human health & environmental benefits cannot be monetized (e.g., mercury reductions)
Early Human Health Benefits of Clear Skies in 2010 • The Clear Skies Act would result in substantial early human health and visibility benefits due to reductions in fine particles and ozone.1 • By 2010, Americans would annually experience approximately: • 7,900 fewer premature deaths; • An alternative estimate projects 4,700 fewer premature deaths;2 • 5,400 fewer cases of chronic bronchitis; • 13,100 fewer non-fatal heart attacks; • 16,900 fewer hospitalizations/emergency room visits for cardiovascular and respiratory symptoms; • Included in this total are 9,000 fewer hospital and emergency room visits for asthma. • 8 million fewer days with respiratory illnesses and symptoms, including work loss days, restricted activity days, and school absences. • Included in this total are hundreds of thousands fewer respiratory symptoms and illnesses for asthmatics, including over 70,000 fewer asthma attacks. • The monetized health benefits of the Clear Skies Act would total approximately $54 billion annually in 2010. • An alternative estimate projects annual health benefits of $10 billion.2
Current Fine Particle (PM2.5) Air Quality • There are 129 counties nationwide (114 counties in the East) that exceed the annual fine particle standard of 15 µ/m3. • 65 million people (43 million people in the East) live in counties that would not meet this standard. Manhattan=red ug/m3 ug/m3 ug/m3 ug/m3 ug/m3 PM 2.5 standard = 15 µg/m3 129 Nonattainment Counties Note: Based on 1999-2001 monitoring data of counties with monitors that have three years of complete data.
Clear Skies Achieves Early Benefits by Bringing More Areas into Attainment with the PM2.5 Standard in 2010 Manhattan=Yellow Manhattan=Orange • PM2.5 attainment status in 2010 Clear Skies case: • Clear Skies would bring 42 additional eastern counties (home to approximately 14 million people) into attainment with the fine particle standard (as compared to the Base Case). Remaining Counties Projected to Exceed the Annual Fine Particle Standards under the Base Case in 2010 Remaining Counties Projected to Exceed the Annual Fine Particle Standards with Clear Skies and the Base Case in 2010 PM 2.5 standard = 15 µg/m3 69 Nonattainment Counties • PM2.5 attainment status in 2010 base case: • Existing programs will bring 45 eastern counties (home to approximately 10 million people) into attainment with the fine particle standard (compared to current conditions). 27 Nonattainment Counties Notes: Based on 1999-2001 data of counties with monitors that have three years of complete data. Additional federal and state programs must bring all counties into attainment by 2016 at the latest. Clear Skies is not expected to bring additional counties into attainment for 2020 in the West. Therefore, the western region is not presented here.
Clear Skies Would Bring More Areas into Attainment with the PM2.5 Standard in 2020 Manhattan=Yellow Manhattan=Gray • PM2.5 attainment status in 2020 Clear Skies Case: • Clear Skies would bring 35 additional eastern counties (home to approximately 12 million people) into attainment with the fine particle standard (as compared to the Base Case). Remaining Counties Projected to Exceed the Annual Fine Particle Standard under the Base Case in 2020 Remaining Counties Projected to Exceed the Annual Fine Particle Standard with Clear Skies and the Base Case in 2020 PM 2.5 standard = 15 µg/m3 43 Nonattainment Counties • PM2.5 attainment status in 2020 base case: • Existing programs will bring 71 eastern counties (home to approximately 18 million people) into attainment with the fine particle standard (compared to current conditions). 8 Nonattainment Counties Notes: Based on 1999-2001 data of counties with monitors that have three years of complete data. Additional federal and state programs must bring all counties into attainment by 2016 at the latest. Clear Skies is not expected to bring additional counties into attainment for 2020 in the West. Therefore, the western region is not presented here.
Current Ozone Air Quality • There are 290 counties nationwide (268 counties in the East) that exceed the 8-hour ozone standard. • 111 million people (87 million people in the East) live in counties that would not meet this standard. 8-hour Ozone Standard = 85 ppb 290 Nonattainment Counties Note: Based on 1999-2001 monitoring data of counties with monitors that have three years of complete data.
Clear Skies Achieves Early Benefits by Bringing More Areas into Attainment with the 8-hour Ozone Standard in 2010 • Ozone attainment status in 2010 Clear Skies case: • The NOx SIP Call will bring many Eastern counties into attainment with the 8-hour ozone standard. • With Clear Skies, as compared to the Base Case, the number of counties out of attainment with the 8-hour ozone standard decreases from 47 to 44 (approximately 1 million more people living in counties in attainment). Remaining Counties Projected to Exceed the 8-hour Ozone Standard under Base Case in 2010 Remaining Counties Projected to Exceed the 8-hour Ozone Standard with Clear Skies and the Base Case in 2010 8-hour Ozone Standard = 85 ppb 47 Nonattainment Counties • Ozone attainment status in 2010 base case: • Existing programs (primarily the NOx SIP Call and vehicle rules) will bring 221 additional eastern counties (home to approximately 61 million people) into attainment with the 8-hour ozone standard (compared to current conditions). 44 Nonattainment Counties Notes: Based on 1999-2001 data of counties with monitors that have three years of complete data. Additional federal and state programs must bring all counties into attainment between 2007 and 2021. Clear Skies is not expected to bring additional counties into attainment for 2010 in the West. Therefore, the western region is not presented here.
Clear Skies Would Bring More Areas into Attainment with the 8-hour Ozone Standard in 2020 • Ozone attainment status in 2020 Clear Skies case: • The NOx SIP Call will bring many Eastern counties into attainment with the 8-hour ozone standard. • Clear Skies would bring 3 additional counties (home to approximately 6 million people) into attainment with the 8-hour ozone standard (as compared to the Base Case). Remaining Counties Projected to Exceed the 8-hour Ozone Standard under Base Case in 2020 Remaining Counties Projected to Exceed the 8-hour Ozone Standard with Clear Skies and the Base Case in 2020 8-hour Ozone Standard = 85 ppb 23 Nonattainment Counties • Ozone attainment status in 2020 base case: • Existing programs (primarily the NOx SIP Call and vehicle rules, including the proposed non-road rule) will bring 245 eastern counties (home to approximately 65 million people) into attainment with the 8-hour ozone standard (compared to current conditions). 20 Nonattainment Counties Notes: Based on 1999-2001 data of counties with monitors that have three years of complete data. Additional federal and state programs must bring all counties into attainment between 2007 and 2021. Clear Skies is not expected to bring additional counties into attainment for 2020 in the West. Therefore, the western region is not presented here.
Visibility Improvements in 2020 Projected Changes in Visibility with the Base Case in 2020 Compared to 2001 • The top map demonstrates the effect of existing programs (Base Case) in comparison to current visibility levels. • The bottom map demonstrates the effect of Clear Skies in combination with the Base Case in comparison to current visibility levels. Projected Changes in Visibility with Clear Skies and the Base Case in 2020 Compared to 2001 Note: Alaska and Hawaii are not included in the model domain • As the lower map shows, Clear Skies in combination with the Base Case, including the proposed Nonroad Diesel rule, would improve visibility in a large portion of the East and Midwest 2-3 deciviews* from current levels. • Visibility in portions of the Southeast and the eastern Plains/Upper Midwest would improve more than 3 deciviews*. Note: Alaska and Hawaii are not included in the model domain *A deciview is a measure of visibility which captures the relationship between air pollution and human perception of visibility. When air is free of the particles that cause visibility degradation, the Deciview Haze Index is zero. The higher the deciview level, the poorer the visibility; a one deciview change translates to a just noticeable change in visibility for most individuals. Note: Neither the Base Case or Clear Skies modeling fully incorporates the additional emission reductions expected from implementation of the WRAP.
Clear Skies Visibility Improvements in 2020 • Clear Skies would improve visibility over much of the Eastern U.S. 1-2 deciviews beyond what is expected under the Base Case (a change of 1-2 deciviews is perceptible). • In the southeastern U.S., this translates into an improvement in visual range of approximately 2-4 miles. • Under Clear Skies, the Western Regional Air Partnership agreement would be honored and the emissions reductions are projected to take effect. • This will allow future growth in the West to occur without degrading visibility. Projected Changes in Visibility with Clear Skies Compared to the Base Case in 2020 Improvement in Deciview National Park Service, U.S. Fish and Wildlife Service, and U.S. Forest Service Class 1 areas Note: Alaska and Hawaii are not included in the model domain Note: Neither the Base Case or Clear Skies modeling fully incorporates the additional emission reductions expected from implementation of the WRAP.
Projected Improvements in Adirondack Lakes Sulfur Deposition Improvements in 2020 • Clear Skies would reduce sulfur deposition up to 60% beyond Base Case in some of the most acid-sensitive regions of the country, including the Appalachian Mountains, southern Blue Ridge, and southeastern U.S. • Together with existing programs, Clear Skies would reduce sulfur deposition 30-60% across the most of the eastern U.S. and several sensitive areas of the West. Projected Changes in Sulfur Deposition with Clear Skies compared to the Base Case in 2020 • Clear Skies would eliminate chronic acidity in Adirondack region lakes by 2030, and only 1% of lakes would remain chronically acidic in the Northeast region. Projected Changes in Sulfur Deposition with Clear Skies and Base Case in 2020 compared to 2001 • Clear Skies would benefit acid-sensitive ecosystems in the Southeast, by slowing the deterioration of stream health expected under the Base Case. Note: Sulfur deposition in the West is generally low. The large percentage increases correspond to relatively small changes in actual deposition from expected increases in emissions primarily from sources not affected by Clear Skies (e.g., metals processing, petroleum refining, chemical and fertilizer manufacturing). A few power plants are expected to increase emissions slightly under existing programs.
Clear Skies Sulfur Deposition Improvements in 2020 • Clear Skies would achieve significant additional reductions in sulfur deposition of up to 60% beyond what is expected under the Base Case in 2020. • The greatest reductions of 30-60% would center on the Appalachian Mountains from northern New York state to the southern Blue Ridge and across broad regions of the southeastern U.S., including sensitive resources such as the Adirondack and Catskill Mountains Projected Changes in Sulfur Deposition with Clear Skies Compared to the Base Case in 2020 Note: Alaska and Hawaii are not included in the model domain
Nitrogen Deposition Improvements in 2020 • The top map demonstrates the effect of existing programs (Base Case) in comparison to current deposition levels. • The bottom map demonstrates the effect of Clear Skies in combination with the Base Case in comparison to current deposition levels. • Clear Skies and the Base Case together would reduce nitrogen deposition across much of the country up to 35%, with larger reductions of up to 50% across most of the East and large areas of the West. Projected Changes in Nitrogen Deposition with the Base Case in 2020 Compared to 2001 Projected Changes in Nitrogen Deposition with Clear Skies and the Base Case in 2020 Compared to 2001 Note: Alaska and Hawaii are not included in the model domain • The projected large reductions in nitrogen deposition on the West coast are due to existing programs not yet fully implemented, such as the Tier II and Diesel Rules. • In the West, Clear Skies would prevent further deterioration of air quality, including visibility. • Clear Skies would allow growth to occur in the West without increasing NOx emissions. Note: Alaska and Hawaii are not included in the model domain Note: The increases in nitrogen deposition in Louisiana and Washington state occur under both the Base Case and Clear Skies and are the result of increases in emissions from manufacturing and refining sources.
Clear Skies Nitrogen Deposition Improvements in 2020 Projected Changes in Nitrogen Deposition with Clear Skies Compared to the Base Case in 2020 • Clear Skies would achieve significant additional reductions of nitrogen deposition of up to 20% beyond what is expected under the Base Case across much of the country, including the East and large portions of the Midwest and West. • Some areas would experience reductions of up to 35% beyond Base Case levels, including areas in the interior mountain west and nitrogen-sensitive estuarine areas in coastal Georgia. Note: Alaska and Hawaii are not included in the model domain
Clear Skies Reduces Nitrogen Loads to the Chesapeake Bay and Other Estuaries • Under the Clear Skies Act, in 2020, oxidized nitrogen deposition to the Chesapeake Bay watershed would be reduced by up to 20% beyond what is expected under the Base Case. • Clear Skies is also expected to reduce nitrogen loads to other nitrogen-sensitive estuaries along the East and Gulf coasts by reducing NOx emissions in their airsheds. Projected Change in Nitrogen Deposition with Clear Skies Compared to the Base Case in 2020 NOx Airsheds for Some East and Gulf Coast Estuaries • These reductions from Clear Skies will help states and estuary management programs meet their nitrogen reduction goals. • For example, Chesapeake Bay States, including NY, VA, MD, PA, DE, WV and DC, recently agreed to incorporate the nitrogen reductions that would result from Clear Skies legislation as part of their overall plan to reduce nutrient loadings to the Bay. Note: An “airshed” depicts a modeled approximation of a large proportion of sources contributing to air quality in a particular receptor region.
Mercury Deposition Improvements in 2020 • The top map demonstrates the effects of existing programs (Base Case) in comparison to current deposition levels. • The bottom map demonstrates the effects of Clear Skies in combination with the Base Case in comparison to current deposition levels. • Clear Skies would, together with the Base Case, contribute to a 15-60%* reduction in mercury deposition from current levels throughout the East and Midwest. Projected Changes in Mercury Deposition with the Base Case in 2020 Compared to 2001 Projected Changes in Mercury Deposition with Clear Skies and the Base Case in 2020 Compared to 2001 Note: Alaska and Hawaii are not included in the model domain • Deposition reductions are expected to occur in many places where fish advisories are in effect due to elevated levels of mercury. • For example, ecosystems in Florida have already been shown to respond quickly to changes in mercury loads. • Over half the reductions in fish tissue concentrations took place in the first ten years. * These results are based on modeling the Clear Skies mercury cap without triggering the safety valve. Note: Alaska and Hawaii are not included in the model domain Note: The increases in mercury deposition occur under the Base Case and with Clear Skies and are the result of increases in emissions from sources other than power plants that are not affected by Clear Skies.
Clear Skies Mercury Deposition Improvements in 2020 Projected Changes in Mercury Deposition with Clear Skies Compared to the Base Case in 2020 • Considering Clear Skies without the safety valve, Clear Skies could potentially reduce mercury deposition 5-15%* beyond the Base Case across much of the East. • In some areas mercury deposition would be reduced up to 60%. Note: Alaska and Hawaii are not included in the model domain * These results are based on modeling the Clear Skies mercury cap without triggering the safety valve.
Projected Annual Costs of the Clear Skies Act • Total annual costs of the Clear Skies Act are projected to be $6.3 billion ($1999) in 2020. • The net present value (NPV) of the difference in costs between Clear Skies and the EPA Base Case is $52.5 billion ($1999) for the period between 2005 and 2025. • The 2003 analysis projects annual costs slightly lower than projected by the 2002 analysis. Note: Cost projections are based on modeling using IPM and are based on best available engineering estimates. These projections show the costs to power generators over and above the costs they will incur to meet statutory and regulatory requirements that are already in effect. The projections do not include costs associated with the purchase of allowances from the auction. Nor do the projections consider future technological changes that could lower compliance costs or electric demand response that would lower costs through reduced power generation. In the absence of Clear Skies legislation, there are existing statutory provisions that will, in the future, require EPA and states to impose additional requirements (and thus additional costs) on power generators between now and 2020 (e.g., states will be required to meet the PM2.5 and ozone NAAQS). When compared to existing Clean Air Act requirements, Clear Skies may actually result in cost savings because a cap-and-trade approach is more efficient than existing regulatory programs. When the Acid Rain Program was implemented using a cap-and-trade program, compliance costs to achieve the mandated reductions were significantly lower than predicted as sources took advantage of the flexibility provided by a cap and trade program. Note: EPA’s net present value calculation is based on annual costs from IPM and cover the years 2005-2025. See chapter 7, table 7.1 of the IPM documentation for more information on the discount rates used for various plant types. (www.epa.gov/airmarkets/epa-ipm/index.html#documentation). Note: The analysis presented represents EPA’s estimates. EIA’s modeling would likely show different impacts.
Conclusion The 2003 analysis reaffirms previous analytical results – Clear Skies provides substantial benefits to the public for a reasonable cost and impact. • Clear Skies delivers approximately $110 billion annually in health benefits by 2020. • An alternative estimate is $21 billion. • Many additional benefits are not monetized. • Benefits begin right after passage of the Act. • Clear Skies yields significant environmental benefits, including important reductions in sulfur, nitrogen, and mercury deposition. Annual monetized benefits of visibility are $3 billion by 2020. • With Clear Skies, by 2020, 35 counties (home to approximately 12 million people) would be brought into attainment with the fine particle standard, leaving only 8 eastern counties in non-attainment. Clear Skies would also bring 3 counties (home to approximately 6 million people) into attainment with the 8-hour ozone standard, and remaining counties closer to attainment. • Clear Skies is projected to cost $6.3 billion annually in 2020 ($1999) and prices of electricity, coal, and natural gas only increase a small amount. Varying key assumptions increases costs by less than 10%. • Technological improvements in emission controls could reduce overall cost of compliance.