Download
1 / 29
290 likes | 390 Views
LCSE & PSC Demonstration of Exploratory Science through Interactively Driven Supercomputer Simualtions. David Porter, Mike Knox, Jim Greensky, James Hansen, Paul Woodward Laboratory for Computational Science & Engineering University of Minnesota. Raghu Reddy & Nathan Stone

E N D
LCSE & PSCDemonstration of Exploratory Sciencethrough Interactively DrivenSupercomputer Simualtions David Porter, Mike Knox, Jim Greensky, James Hansen, Paul Woodward Laboratory for Computational Science & EngineeringUniversity of Minnesota Raghu Reddy & Nathan Stone Pittsburgh Supercomputing Center
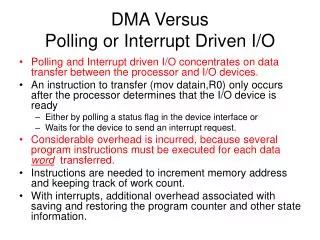
The Goal is Scientific Exploration: • Scientific productivity requires the ability to rapidly answer “What if?” • Batch processing on today’s supercomputers gives answers only in weeks or months. • Exploratory runs are now done mostly on small local resources, but these also take weeks or months.
Enabling Exploration is not about cost: • The cost of local or remote computation goes with the time used, not the time interval over which this use occurs. • Exploration can be enabled by moving smaller runs from slow local resources to fast supercomputers.
Why has this not already happened? Today’s supercomputers are not efficient on smaller problems. Today’s scheduling of supercomputer runs discourages rapid turn around of smaller runs. Effective interaction with a fast, smaller run requires prompt graphics and prompt response to user decisions.
We have addressed causes 1 and 3: • PSC’s Cray Red Storm system has a fast, low latency interconnect that permits smaller runs to be efficient on the full machine. • The emerging National LambdaRail network permits prompt graphical output at remote user sites and prompt supercomputer response to user commands.
Efficiency of small runs: • Implementing small runs on large systems demands that tasks executed in parallel be small. • Each task • Reads a data context. • Operates on the data context in private. • Writes the resulting data. • Selects next task.
Efficiency of small tasks: • Computation to Communication ratio decreases with task size. • Smaller data context means less opportunity for data reuse. • Smaller data context means larger surface to volume ratio. • Smaller data context means smaller vector lengths. • Interconnect is the key item.
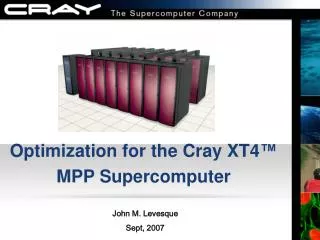
Benefits of Cray Red Storm system: • Processors are fast:1 Gflop/s on grid brick update.0.867 Gflop/s with all costs. • Interconnect is fast:several times Myrinet speed.Very low latency. • Mahcine scales to large configuration.2000 CPUs at PSC.
Getting the task size down: • To reduce task size while keeping surface to volume ratio and vector lengths up we might: • Do just single time step update • Or, better, do just single 1-D pass • Or, better still, do just single 1-D grid pencil update. • #3 requires 2-level hierarchy of parallel task management.
Where we are today: • Each CPU updates for a single time step a grid brick of 643 cells. • Takes 1.1 sec. @ 867 Mflop/s/CPU. • A run on a 5123 grid needing 5,000 steps takes 1.5 hours on 512 CPUs • Breaking present tasks into 64 separate 8×8×64 cell updates by teams of 16 CPUs should bring running time down to just 23 min.
Prompt Graphics & Interactive Control: • These 2 functions must go together. • User must be able to generate desired view of desired variable on demand. • Respond on next time step. • Stream of graphical images, not just one snap shot, so can see dynamics. • For speed, have several pre-defined variables and pre-defined views. • See anything desired, with some lag.
User Control Interface: • GUI on Windows PC. • Modifies contents of small text file. • Start, Pause, Continue, Run To, Stop. • Specifies rectangular solid of bricks in which graphical data is generated. • Specifies # time steps per dump. • Specifies which variable to view. • Specifies viewing parameters on local system (color, opacity, view).
User Control Interface: • Sends commands for run initialization (parameters of this run) • Can modify parameters of the graphical output (what, where, how often, how viewed locally) on the fly • Can pause, continue, stop, restart run. • Can modify what output is generated for archiving, and where this is sent.
I/O Pipeline, 30 MB/sec PSC to LCSE: • Each CPU on Red Storm writes separate data brick over Portals. • These are concatenated and dispatched over network in 11 streams • These arrive at the user site (LCSE). • Daemon constructs standard HVR volume rendering data file. • Daemon broadcasts HV-files to 10 PowerWall rendering nodes on IB.
PowerWall Image Rendering: • 10 Dell PC workstations each render their own portions of a single image. • Several images generated per second at full 13 Mpixel PowerWall resol. • Infiniband network allows data broadcast from node on network to keep up with the data flow. • 4 TB local fast disk space on each node can hold accumulating data.
A Brief History of Interactive Simulation with PPM: • 1978, 20 min. 1-D run of twin blast wave problem on Cray-1 with prompt line plots on TV in office. • 1984, 6 hour weekend day run of 2-D jet on 4-CPU Cray-XMP with contour plots on TV in office, but color graphics only days later on Dicomed film recorder.
A Brief History of Interactive Simulation with PPM: • 1988, 30 min. simulation of convection on coarse 2-D grid on Cray YMP in Eagan with prompt graphics in Cray exhibit booth at Supercomputing 88 conference in Florida.D. Porter, P. Woodward, D. Ofelt, U.Mn.; C. Kirchhof, Cray.
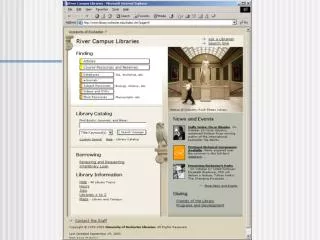
A Brief History of Interactive Simulation with PPM: • 1993, 15 minute run of flow over deformable obstacle on 2562 grid on 36-CPU SGI Challenge XL server with graphics on console and user interaction at SC93 in Portland.K. Chin-Purcell, D. Porter, P. Woodward, U. Mn.; D. Pero, SGI.
A Brief History of Interactive Simulation with PPM: • 1994, 5 minute run of 2-D flow around user alterable obstacle on 1024×512 grid on 512 CM-5 nodes @ 4 Gflop/s with graphics on SGI at AHPCRC.B. K. Edgar, T. Varghese, T. Parr, D. Porter, P. Woodward, U.Mn.;K. Fickie, BRL.
A Brief History of Interactive Simulation with PPM: • 2000, 2-D flows on grids of 256×128 on Dell laptop @ 280 Mflop/s in minutes with VB6 GUI.P. Woodward
A Brief History of Interactive Simulation with PPM: • 2001, 3-D advection of smoke streams in prescribed hurricane flow field on 32-CPU Itanium cluster @ 16 Gflop/s with prompt 3-D graphics on PC over fast Ethernet at SC2001 in Denver.S. Anderson, D. Porter, P. Woodward, UMn.; R. Wilhelmson, NCSA.
A Brief History of Interactive Simulation with PPM: • 2003, 2-D multifluid flow on grid of 512×384 cells on 15-CPU Unisys ES-7000 in 4 minutes @ 6 Gflop/s with prompt graphics to remote location at Mn. state fair.P. Woodward, B. Allen, S. Anderson, D. Porter, UMn.;J. Chase, Fond du Lac.
2300 fairgoers were blown away by the ES7000 at the LCSE in August, 2003.
A Brief History of Interactive Simulation with PPM: • 2005, 3-D shear layer run on grid of 963 grid in 45 minutes on Dell laptop @ 1.3 Gflop/s.P. Woodward
A Brief History of Interactive Simulation with PPM: • 2005, 3-D shear layer run on grid of 5123 cells in 2 hours on PSC Cray Red Storm (using 512 CPUs) with prompt 3-D graphics on LCSE PowerWall. (well, almost, but this really works in San Diego).This project (see names on title slide).
System now under construction in the LCSE. Dell 670nDual 3.6 Xeon EM64 8GB DDR2 SDRAM Dell PC nodes can act as intelligent storage servers and also as image generation engines.
Prototyping Effort Now: • have 14 Dell nodes, each with: • Dual P4 Xeon @ 3.6 GHz • 8 GB memory • nVidia Quadro 4400 graphics card • 12 Seagate 400 GB SATA disks • 3Ware 12-channel SATA controller • Infiniband 4X (Topspin) HCA • 10 IB4X links to Unisys ES7000 with 32 Itanium-2 CPUs & 64 GB memory.