Download
1 / 65
660 likes | 797 Views
IPE-K < Lecture Note 3> 2013.03.22. IPE -K: Technological Innovation and International Competitiveness * Some parts of this note are borrowed from references for teaching purpose only. Semester : Spring 2013 Time: Friday 9:00~12:00 am Class Room: No. 322

E N D
IPE-K <Lecture Note 3> 2013.03.22 IPE-K: Technological Innovation and International Competitiveness *Some parts of this note are borrowed from references for teaching purpose only. Semester: Spring 2013 Time: Friday 9:00~12:00 am Class Room: No. 322 Professor: YooSoo Hong Office Hour: By appointment Mobile: 010-4001-8060 E-mail: yshong123@gmail.com Home P.: //yoosoohong.weebly.com
Korea Today • IT Industry • Strong Engines for nation’s development • - Broadband Internet • - Digital Multimedia Broadcasting • - Wireless Broadband Internet • - HD/LCD TV • - IT Application to Automobile, Shipbuilding & Machinery • Shipbuilding Industry • World’s 1st Shipbuilding country, Market Share 40 %, Drill ship • Korea’s World Class Enterprises • SAMSUNG • HYUNDAI • LG • SK • POSCO
Korean Electronics Leading the World Market (% in the world) Memory (45.0%) CP (28.8%) TFTLCD (41.3%) MP3 (20%) DTV (13%) Contribution to the Korean economy by share: GDP (14%) and Export (30%)
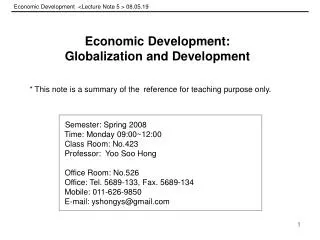
Miracle on the Han River High accelerated growth - Exports - Rapid industrialization - Technological achievement - Education boom - Rapid urbanization - Exponential rise in living standards • ‘Miracle’ - Rapid development of post war Korea into the 13th largest economy of the world - A role model for many developing countries
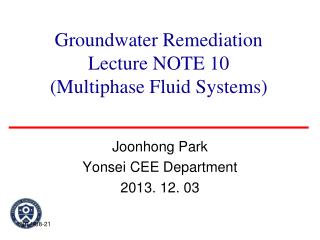
Capacity Building Stages and Model Creation Improvement Assimilation Acquisition S&T & R&D Stages Imitation internalization generating Developing Country Newly-Industrializing Country Advanced Country Development Stages
Changes in the Interactions between the Government and the Market (1980s) Government and Market Compromised System (P-II) Government-Driven Economic System (P-I) Market Field Government Enterprises Government Finance Finance Enterprises Market Field 7
Industry • Export-driven economy • - 39.4% to the GDP from exports • Leading export sectors • - Semiconductors • OLED, LCD, plasma screens and CRTs. • Biggest manufacturing conglomerates of semiconductors in the world. • - Wireless telecom equipment • 40 million subscribers • 20 million fixed lines • one of the fastest broadband networks
- Motor vehicles • Revenues of $25.4 billion • CAGR of 13.7% (2003-2007) • - Ships • Produces more vessels than the entire world’s production put together • The biggest shipbuilding yard in the world, a new vessel every four days • - Computers • - Steel • - Petrochemicals
Change of Industrial Structure Over Times * Note : 1) Data before 1950 are based on the criteria of 1975, and data after 1970 are based on the 2000 & total amount of value added. 2) Data before 1960 include construction industry ※ Source : The Bank of Korea
Top 10 Leading Industries in the Republic of Korea’s Manufacturing Sectors Source: Bank of Korea. National Accounts and Statistical Yearbook
1960s 1970s 1980s 1990s 2000s Industryfor Promotion LightIndustry Heavy andChemical Industry Technology-intensiveIndustry Knowledge- Intensive Industry New Industry IncludingICT Factors ofCompetitive-ness SimpleLabor SkilledLabor Capital Technology Innovation Change of Industrial Structure ※ Source : Hwang, Yongsoo(2007), “Role and Performance of S&T Policy to Cope with Transitional Needs of Economic Development”, Symposium for the Forty Anniversary of S&T Administration in Korea, 2007. 10. 29, MOST & STPEI, Seoul
Industrialization and S&T development HowKorea acquired technology for industrialization - Acquisition of technologies for development : ’60s and ’70s Development of light industries and heavy chemical industries for import substitution and export-expansion - Generated enormous demand for technologies that were not available from domestic sources Policy responses - Promotion of inward transfer of technologies - Developing domestic absorptive capacity to digest, assimilate and improve upon the transferred technologies
Private industries’ responses - Light industries (shoes, clothing, textile…) Rely on OEM production arrangements - Chemical industries Resort to turn key-plant importation with technical training - Electric and machineries Relatively more reliant on FL FDI and FL played relatively less important role in technology transfer in the process of industrialization of Korea. Korea relied on its HR for learning from foreign technologies transferred through informal channels.
How Korea built up an indigenous R&D system - Korean economic growth into the 1980s • Increased demand for complex and sophisticated technologies • Increasing reluctance of foreign countries to transfer technologies to Korea - Policy response • Launching the NRDP and promoting private industrial R&D • NRDP in 1982 • Policy incentives for industrial R&D: financial, fiscal, tax, etc.
Science & Technology strategy Roadmap of Korea Government 1960s 1970s 1980s 1990s 2000s 2010s CompetitiveDevelop-mentStage Factor Driven Stage Investment Driven Stage Innovation Driven Stage New Growth EngineDriven Stage Cheap labor Manufacturing capability Source ofCompetition Innovative capability Convergence capability Major direction ofIndustrial Policy Expand exportoriented lightindustries Expand heavy and chemical industries Expand technology Intensive industries Promotehigh-technologyinnovation TechnologyCommer-cialization Green Growth & New Growth Engines
Science and Technology Strategy Roadmap of Korea Government 1960s 1970s 1980s 1990s 2000s 2010s R&D and PrivateResearchLabPromotion S&T Role of Government ScientificInfra-structureSetting R&D andInvestmentPromotion Green Technology Promotion Scientific Institution Building Leading Strategic Area • Strategic program (highly advanced national project) • Enhancing university research capability • Linkages university- industry-govern-ment research institutes • Strategic increase of R&D invest-ment in GT • Promoting GT transfer and commercialization • Strengthening incentive schemes for inducing private invest-ment in GT • Establishment of ministry of S&T • S&T promotion law • Human resource development • Strategic program for tech. Business (R&BD, TBI, NTB) • Globalization of technology • Pursuit newly launched technology business and investment • Establishment of government research institutes • R&D promotion law • Highly qualified personnel development • National R&D funds • Promotion of the establish- ment of private research labs • Promotion of industrial R&D Innovative Capability of Private secret
ChronologyofMajorS&TPolicyMeasures • Establishment of KIST (1966), MOST (1967) • S&T Promotion Act (1967) 1960s • Establishment of GRIs in the field of chemical & heavy industries from mid-1970s • Construction of Daeduk Science Town (Started in 1974) 1970s • Launching of the national R&D program (1982) • Promoting private firm’s research institutes by reforming financial & tax incentives to stimulate R&D investment 1980s • Promotion of university research: SRC, ERC, etc. • Introduction of new types of nat’l R&D programs • - Highly Advanced Nat’l Program, The 21st Century Frontier R&D Program. • Establishment of inter-ministerial coordination body: NSTC 1990s • Introduction of National Technology Road Map (NTRM) • - To suggest TRMs for key technologies to secure products/functions. • Introduction of overall coordination system • - Office of S&T Innovation in MOST was created in Oct. 2004 2000s
Technology InnovationContributions of Factors to Growth (1971~2004)
Factors of International Competitiveness Source: Korea Exim Bank
Trend of Korea’s R&D expenditures Note: The public sector includes CGRIs, universities, and non-profit research institutes. Source: KISTEP, DB (2007)
Ratio of R&D to GDP R&D Expenditure by Source (2006) % Researchers by Degree by Organization R&D Expenditure by Organization % Person 24
Gross Expenditures on R&D in PPP by Country and as Percentage of Global Expenditures 2010
Key Factors of the Korean NIS Outward-looking development strategy Pressure for R&D investment - Government policy toward FDI and TT Focus on indigenous R&D Government-led industrial development - Industry-targeting Inter-industry R&D imbalance - Favoring large enterprises R&D system biased for large firms/Financial capability to invest in R&D - S&T for industrialization R&D system biased toward technology development - Rich pool of well educate HRST High absorptive capacity - Government-led development of S&T infrastructure Relative importance of GRIs
Strength Strength - Consensus on the importance of S&T: Dynamism of Korean business enterprises plus strong commitment of the government to S&T-based national development - Economic environments conducive to active innovation: Domestic firms’ exposure to international markets--pressure for R&D - Chaebol system: Financial capability to invest in long-term risky projects Human resources - Growing scientific achievements: publications, IPR, etc - Attained technological leadership in selected areas
Large firms dominating export structure Although the number of SMEs and MSEs is 99.9% of the total, their export of share is only 39.4%. Desirable growth of SMEs - SME → MSE → Global Hidden Champion Polarization and Needs for High-growth SMEs High Dependency on Large Firms Large ent. 0.13% 60.59% Number Exports Mid ent. 0.32% 8.91% Small ent. 99.55% 30.50% Source: K-Biz. Small Biz Economic Institute. KITA. 2007
Exports by Small and Large Firms (Unit: Million US dollars, %) Note: The numbers in the parenthesis are the shares in total exports Source: The Export-Import Bank of Korea 32
Korean Firms’ Strong Performance • Korean and Japanese companies in crises - Korean companies experienced growth in business and profits in 2009 while Japanese companies suffered sales declines and deteriorating profits. - Japanese companies in the past served as benchmarks for Korean rivals but in 2009 the situations have reserved. • From local to global after one decade - The recent successes of Korean companies can be partially attributed to the painful lessons learned during the 1997 Asian currency crisis. Having witnessed nearly half of the country’s top fifty companies collapse, the remaining companies have since developed a keen sense of how to handle crises. - Korean manufacturers maintained rapid growth averaging 15 percent in the ten years leading up to the 1997 crisis. - This rapid growth was possible due to large investments in Korea’s major industries of steel, automobiles, and electronics. - The Asian currency crisis fundamentally changed the management paradigm in Korea’s corporate community.
- Companies shifted focus to profitable growth and management efficiency and adopted a management mode that enabled continuous corporate restructuring. - As a result, the restructuring led to a marked improvement of internal core competencies, while at the same time the rate of company growth slowed significantly.
Korea Conquered US TV Market • Current Market Leader - The combined market share of Korean electronic makers Samsung and LG surpassed 50% in USA, the largest TV market in the world, for the first time in 2011. - In the flat panel TV market, Samsung came in first with 37% market share in the third quarter. LG came in second with 13%, followed by Panasonic of 9%, Sony of 9%, and Toshiba of 7%. - Korean electronic makers show stronger performance in the high-end TV market in USA, with Samsung selling the most expensive TV. - On the other hand, Sony’s market share decreased from 28% in the first quarter to 15% in the second quarter, and 12% in the third quarter.
Market Share of 3D LCD TV in USA (2011) Source: MD
Increasing Market Share of Korean Makers • In the first quarter of 2011, combined market share of Samsung and LG was 57% (Samsung 51%, LG 6%) • In the third quarter, it increased to 71% with LG increasing its share by 9% (Samsung 56%, LG 15%) • Korean makers are also taking the lead in the European market. Samsung ranked number one in the European display market in the second quarter with 32%, followed by LG in the second place with 19% market share.
SERI Corporate Competitiveness Model • Competitiveness of Korea’s top 100 - SERI CI consists of two axes: internal resources (physical structure) and differentiation (strengths). Derived from the three factors of traditional corporate management (human resources, materials, and financial capital), internal resources are defined as human capital, investment capabilities, and soundness of capital structure. - Differentiation consists of operational excellence, product leadership, and customer intimacy. To measure the Key Success Factor (KSF), SERI elected corporate earnings, universality of data, and measurability as components of the Key Performance Indicator (KPI). - Even if considered on the basis of internal resources alone, Korean companies seemed well positioned to take on almost any task. - Korea’s corporate ecosystem is led by a handful of globalized companies that have improved their competitiveness significantly over the years.
Future Direction - On top of competitiveness, two additional factors will play a positive role in the advancement of Korea’s global companies. The first factor is that the center of economic activity is shifting from the advanced economies to China and other emerging economies, where Korean companies are performing well. - Second, Korean companies have traditionally been active in responding to change, via innovative investment and speedy action, meaning that they have plenty dynamic capabilities which is closely related to corporate growth during transition phases. - If Korean companies could strengthen their networking capabilities and brand power, they could emerge in an even more dominant position on the global stage.
Samsung History • Established in 1969 to manufacture black and white TV sets • Purchased a Korea Semiconductor Business in 1974 • In 1980 dedicated most of its resources to semiconductor business and built its first manufacturing facility. • By early 1990’s, was amongst the industry’s top contenders • Brand value rank grew from 43rd in the world ($ 5.2 billion) in 2000 to 21st in the world ( $12.6 billion) in 2004 and 20th in 2006 (16.1 billion) • Ahead of many brands such as Pepsi, Google, and Siemens • Total net revenue in 2004 was $78.5 billion, and $78.7 billion in 2006
Samsung Structure Spans 58 countries Samsung Electronics has 5 business divisions : – Semiconductor – Digital Media – Telecommunications – LCD – Digital Appliances
Samsung DRAM Facts 2nd Largest chipmaker worldwide (2006) Market leader in DRAM 1992 - 2007 – Total DRAM Volume 896.4M units (2003) – Over 1,200 DRAM products • “Frontier” to legacy products • Specialty and customized products – Versus competitors: • Average price premium: 34% • Average operating margin difference: +53%
Samsung Performance Cost Advantages – Lowest raw materials cost (volume) – Lowest depreciation – Labor and SG&A (Selling, General and Administrative Expenses) not high – Shared core designs – Lower cost fabs (12%) – Flexible production lines – Higher yields (because of process quality) Highest Price – Highest reliability in industry: >$1 premium
Generic Competitive Strategies of Samsung Lower Cost Differentiation Overall Low-Cost Provider Strategy (Commodity DRAM) Broad Differentiation Strategy (Cutting Edge DRAM) Broad Range of Buyers Best-Cost Provider Strategy (Samsung’s Strategy) Target Market Focused Low-Cost Strategy (Low cost flash memory) Focused Differentiation Strategy (Rambus DRAM) Narrow Buyer Segment or Niche
Comparison of the Operating Profits of Samsung and Japanese Electronics Companies (Jul-Sep, 2009) (Yen Billion) Source: Compiled from Japanese Newspapers 48
Distribution of Enterprises by Size (Manufacturing) (%) Note: Mexico is 2004. Source: OECD. Small and Medium Enterprise Outlook. 2005.
SMEs and Employment Status of SMEs in the Korean Industry • The weight (share) of SMEs has been steadily increasing in the 1980s, which reflects their positive role in economic development. • SMEs contribute to employment creation and forming the basis of the economy. The terms of number of enterprises, their share is 99.9% and the share of employment is 87.5%. Thousand enterprises Million persons No. of enterprises No. of employees