Download
1 / 5
50 likes | 155 Views
Supplemental Fig. S1. B. Group A. Group B. A. 24 h. 6 h. 462. 77. 122. Group C. Supplemental Fig. S1 Genes that are predominantly expressed in the endosperms of germinating seeds

E N D
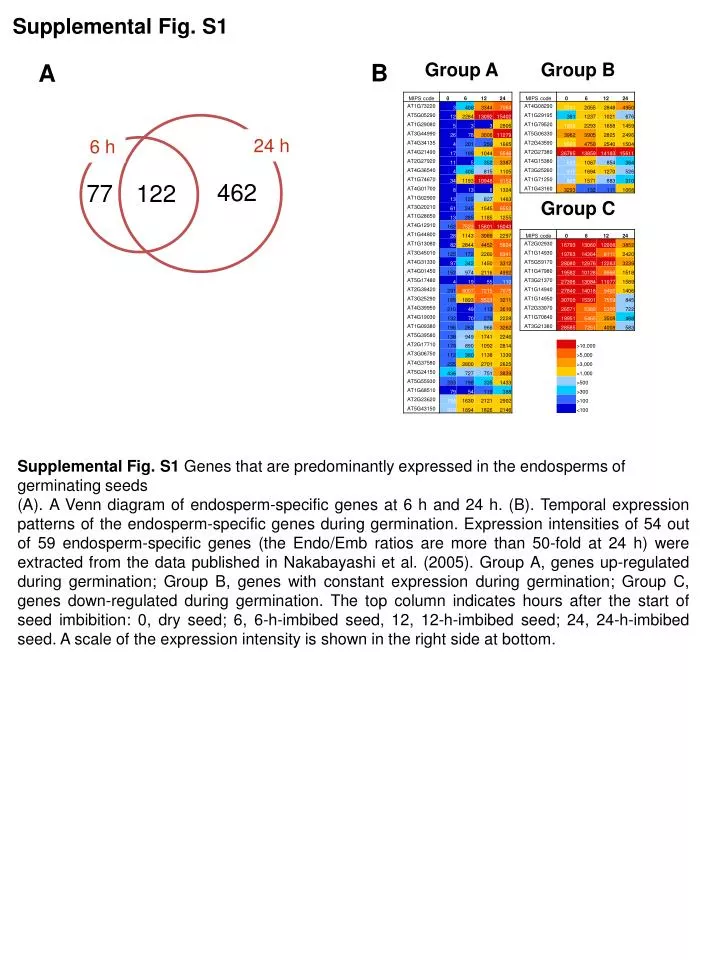
Supplemental Fig. S1 B Group A Group B A 24 h 6 h 462 77 122 Group C Supplemental Fig. S1 Genes that are predominantly expressed in the endosperms of germinating seeds (A). A Venn diagram of endosperm-specific genes at 6 h and 24 h. (B). Temporal expression patterns of the endosperm-specific genes during germination. Expression intensities of 54 out of 59 endosperm-specific genes (the Endo/Emb ratios are more than 50-fold at 24 h) were extracted from the data published in Nakabayashi et al. (2005). Group A, genes up-regulated during germination; Group B, genes with constant expression during germination; Group C, genes down-regulated during germination. The top column indicates hours after the start of seed imbibition: 0, dry seed; 6, 6-h-imbibed seed, 12, 12-h-imbibed seed; 24, 24-h-imbibed seed. A scale of the expression intensity is shown in the right side at bottom.
Supplemental Fig. S2 A B 6 h 24 h 6 h 24 h FL FL BF BF FL FL Supplemental Fig. S2 Flavonol accumulation in Cvi seeds. Dissected endosperm (A) and embryo (B). Left, 6-h imbibed seed; right, 24-h imbibed seed. From top to bottom, DPBA fluorescence (FL), bright field (BF), and DPBA fluorescence (FL) with a larger magnification. Bars in 1st and 3rd lines indicate 300 mm and 50 mm, respectively. Subcellular localization of flavonols in the endosperm.
Supplemental Fig. S3 Col tt4 FL endosperm BF FL embryo BF Supplemental Fig. S3 DPBA staining in wild-type and tt4 seeds. FL and BF indicates DPBA fluorescence and bright field, respectively. A bar indicates 300 mm.
Col Cvi Supplemental Fig. S4 6 h 24 h 6 h 24 h FL BF endosperm FL BF FL BF embryo FL BF
Supplemental Fig. S4 Non-DPBA-treated seeds. From left to right, 6-h imbibed Columbia seed, 24-h imbibed Columbia seed, 6-h imbibed Cvi seed, 24-h imbibed Cvi seed. From top to bottom, line 1~4 show dissected endosperm and line 5~8 show dissected embryo. Images were obtained under same conditions as Fig. 4 without DPBA staining (FL) or under bright field (BF). Bars in 1st and 5th lines indicate 300 mm, and bars in 3rd and 7th lines indicate 50 mm.